


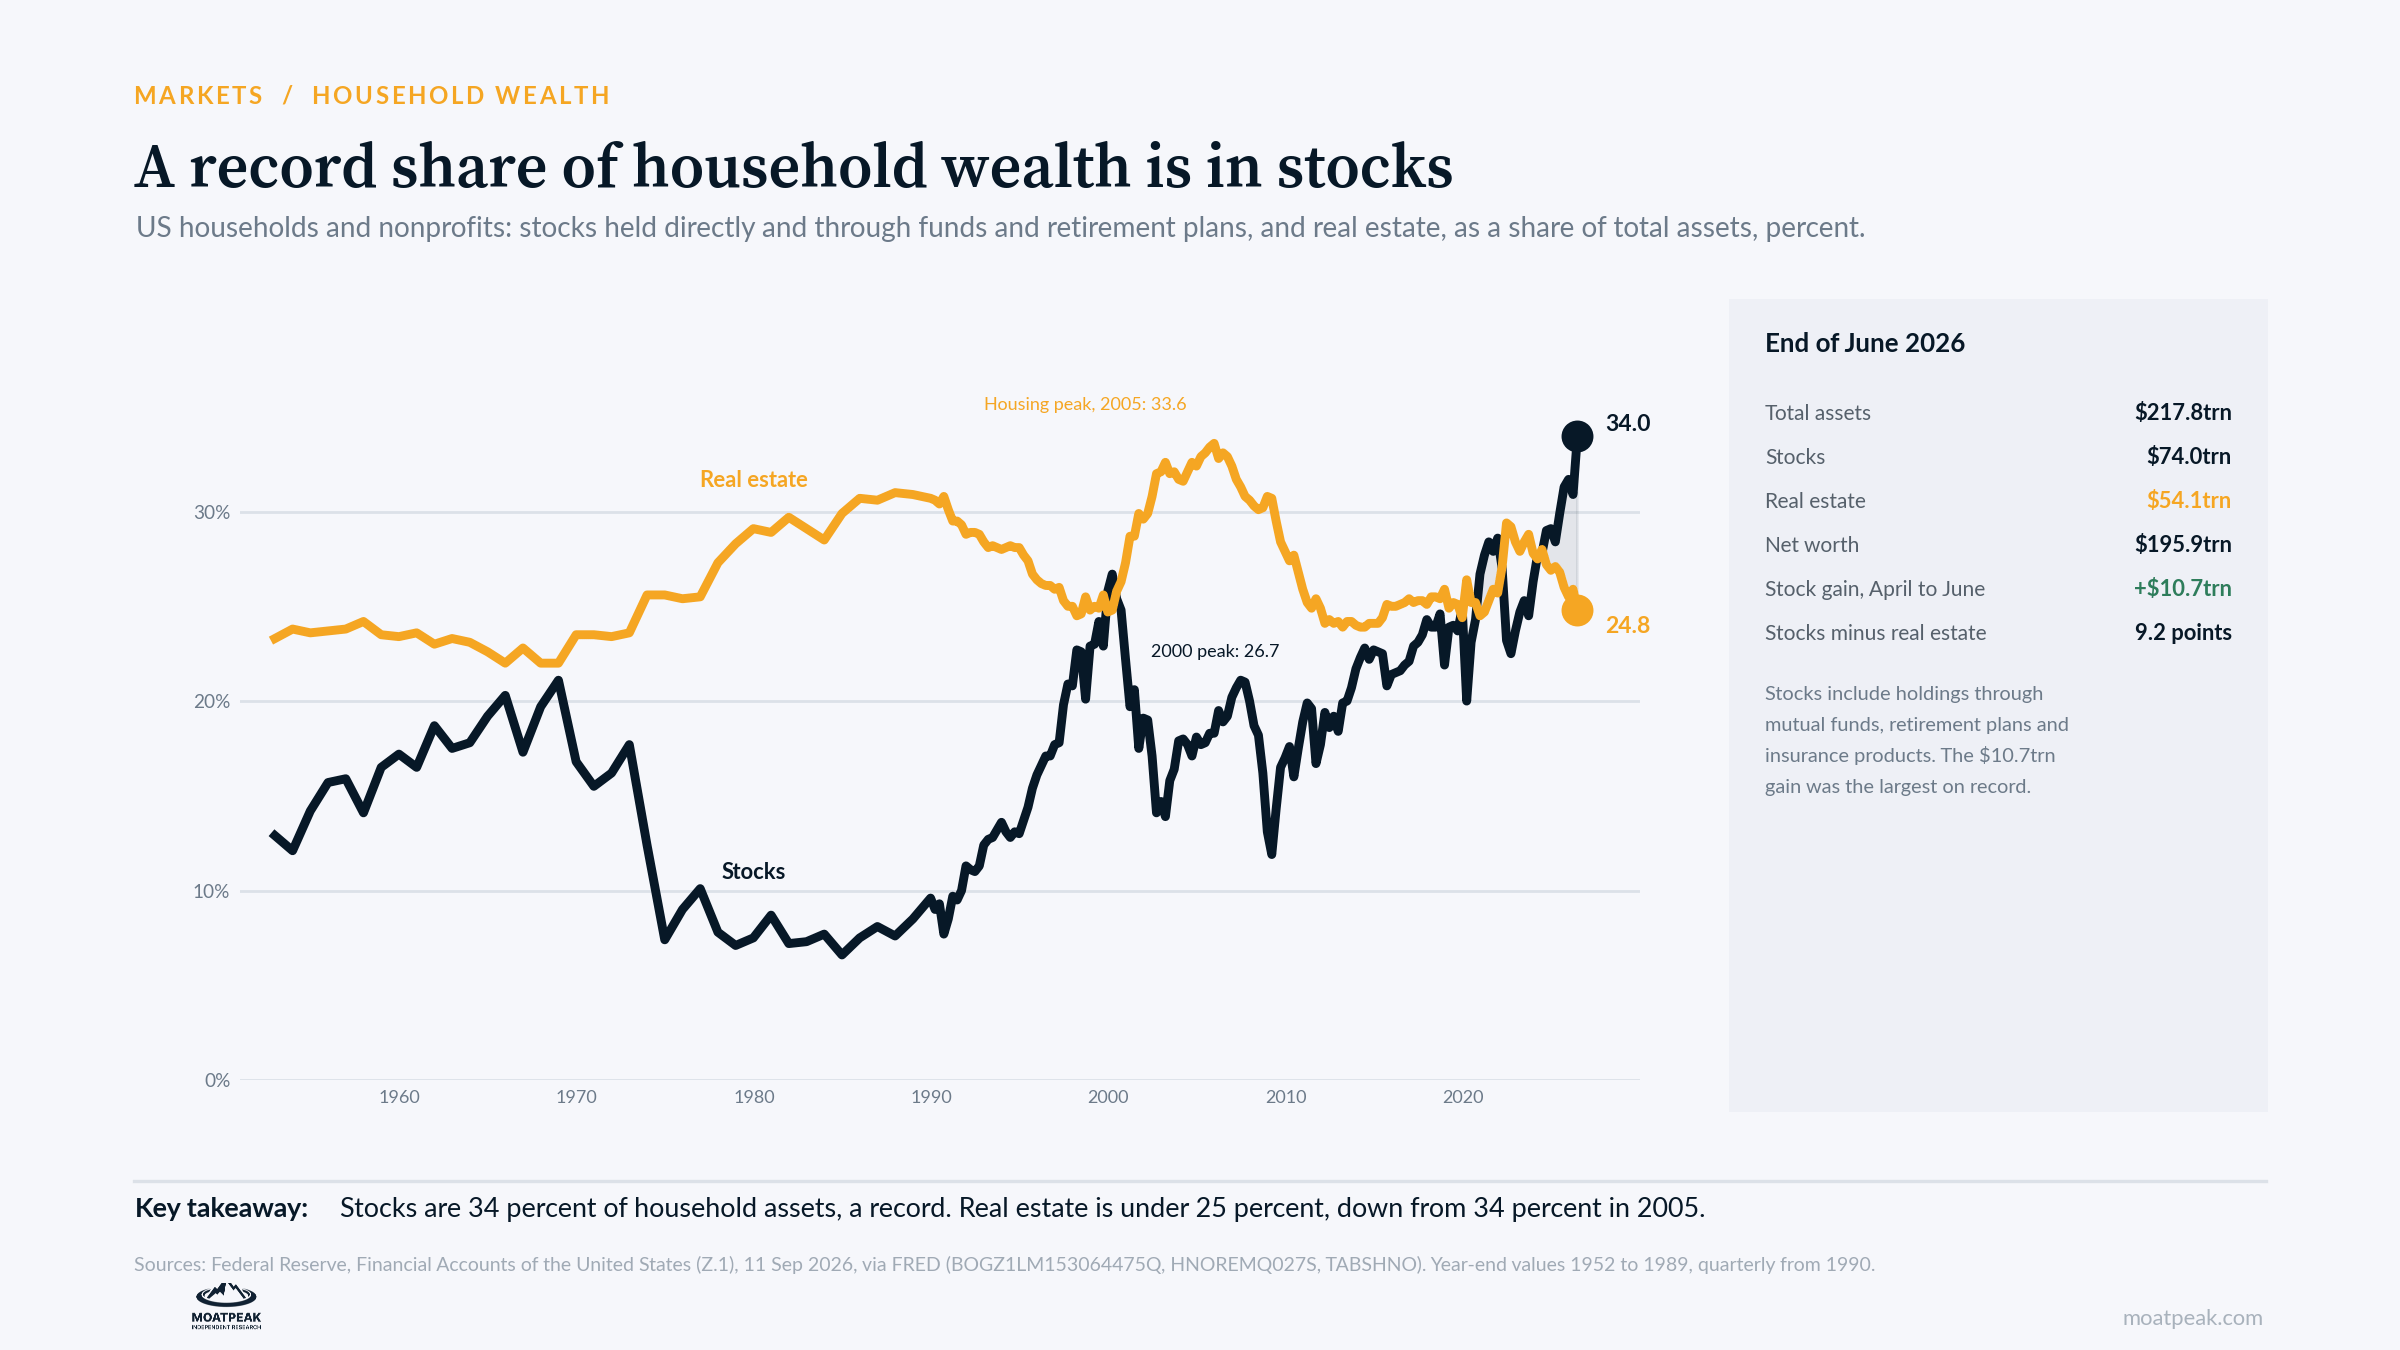
US households and nonprofits held $74.0 trillion of stocks at the end of June, either directly or through mutual funds, retirement plans and insurance products, the Federal Reserve’s financial accounts show. That is 34.0 percent of their $217.8 trillion of total assets, the highest share since the Fed’s records began in 1945.
Real estate made up 24.8 percent, or $54.1 trillion. Stocks have now been ahead of real estate for eight quarters in a row, and the gap of 9.2 percentage points is the widest on record.
How we got here
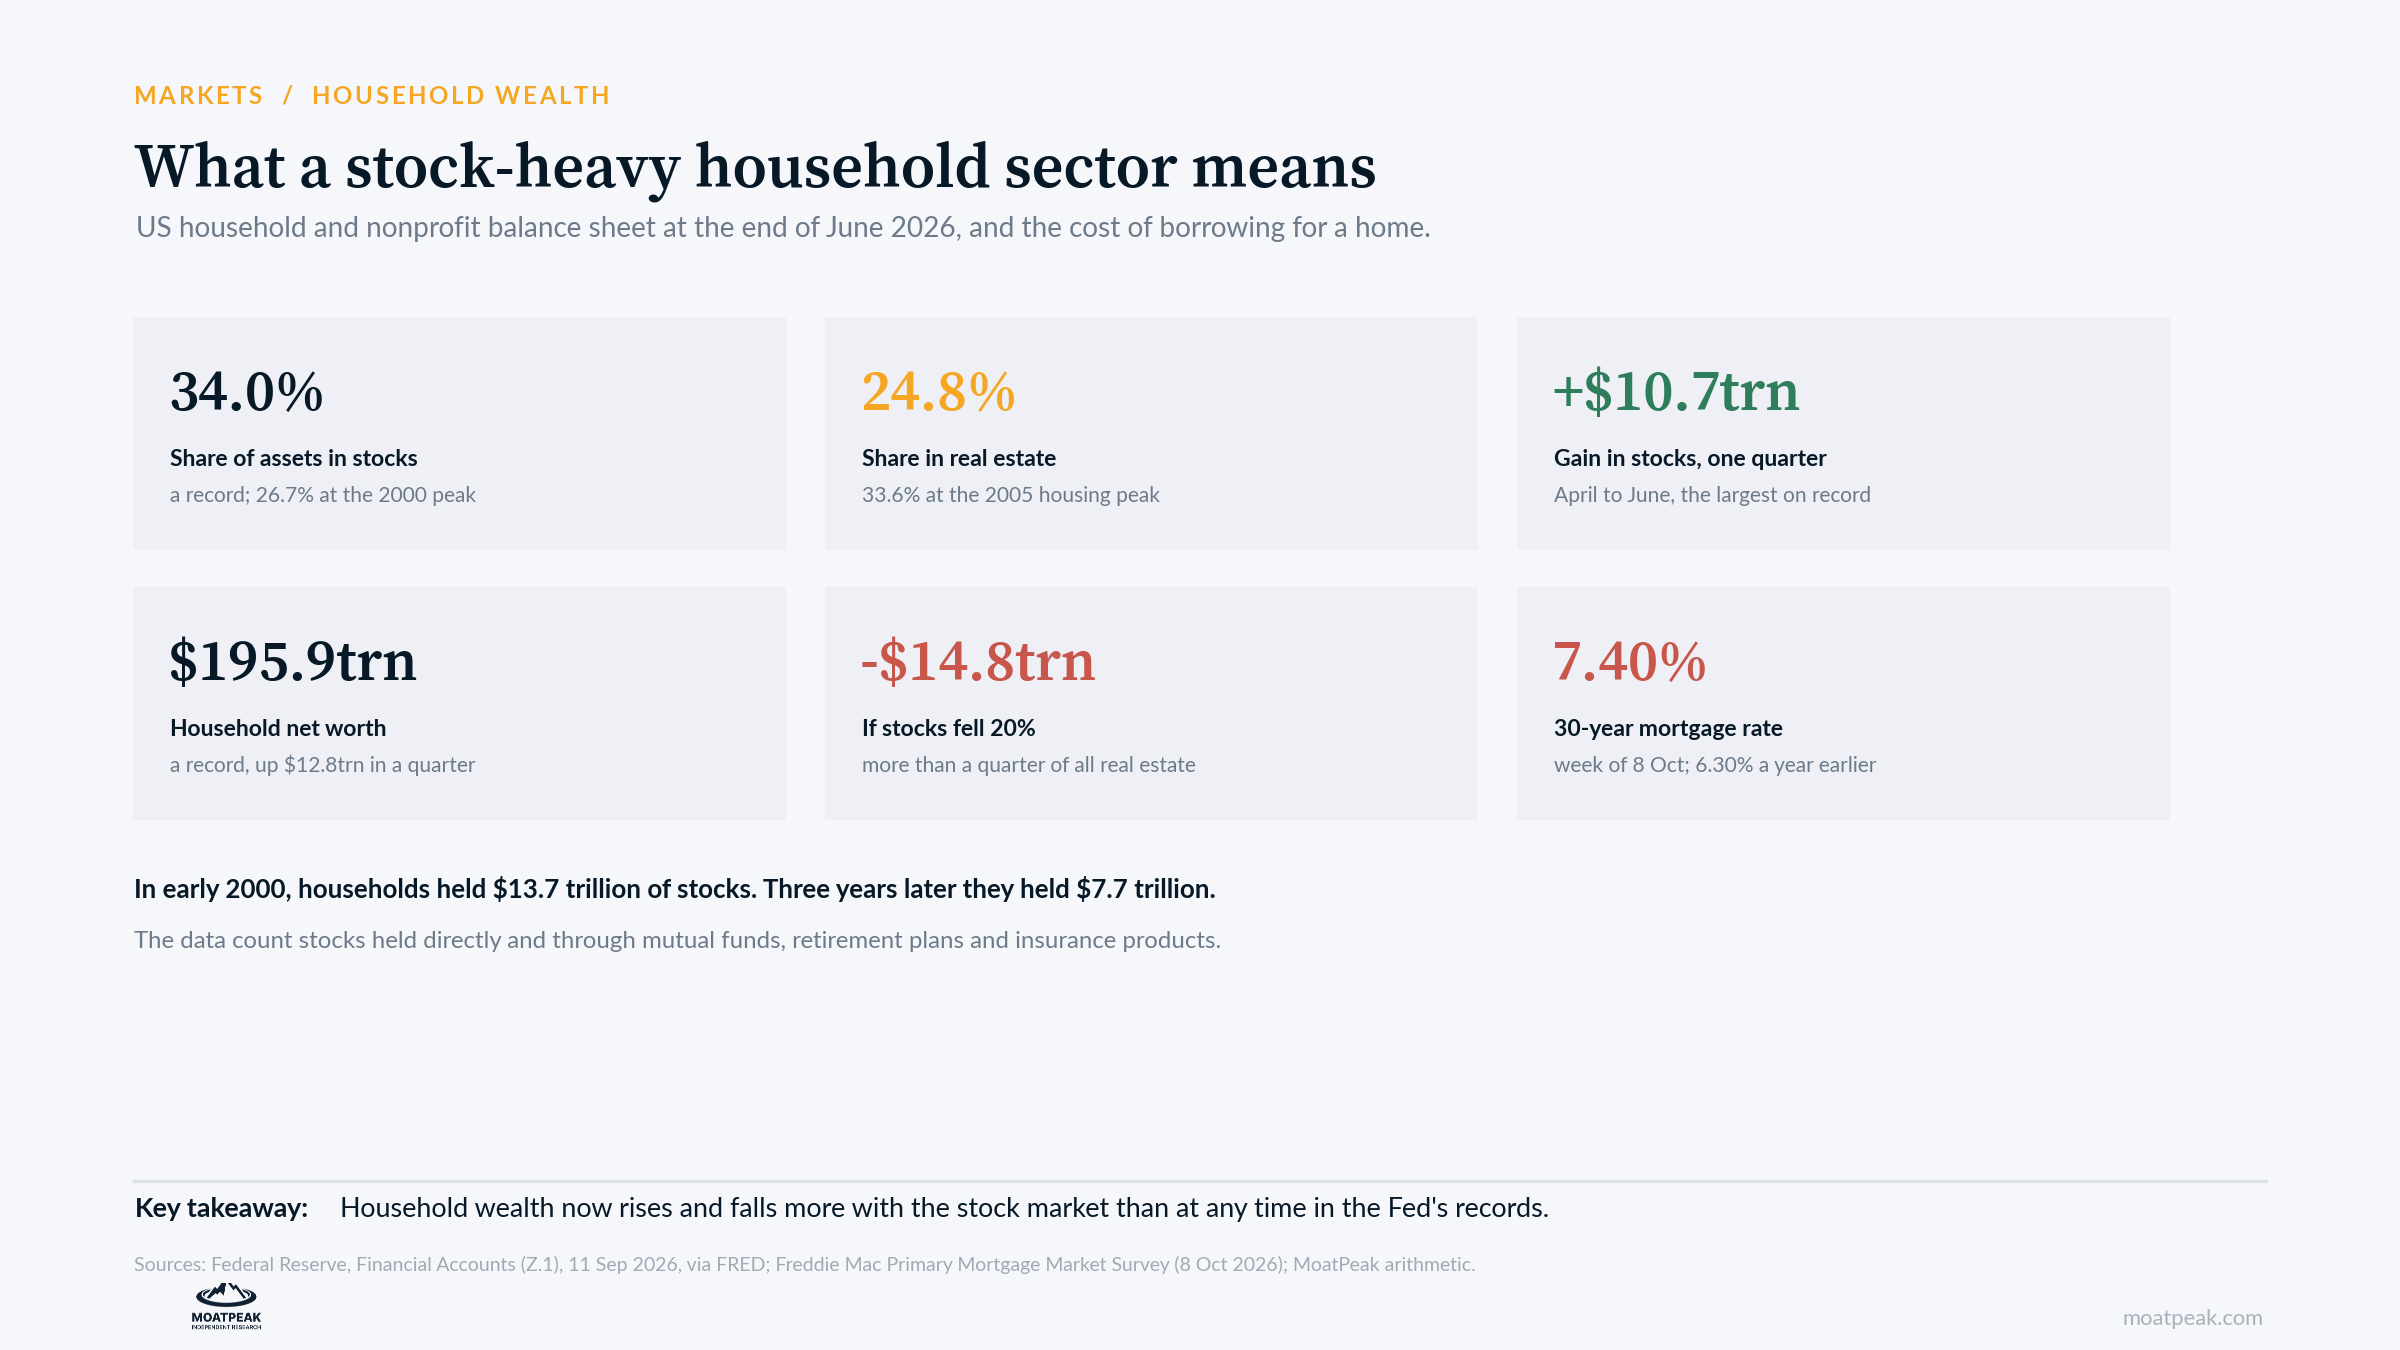
The spring rally did most of it. Household stock holdings rose $10.7 trillion between April and June, the largest quarterly gain in the data. Household net worth rose $12.8 trillion to $195.9 trillion, also a record, which the Fed said was “primarily driven by strong capital gains on corporate equity assets.”
Homes did far less. The value of household real estate rose 2.9 percent over the year to June, less than inflation. With the 30-year mortgage rate at 7.40 percent, up from 6.30 percent a year earlier according to Freddie Mac, buying a home has become harder.
Twenty years ago it was the other way around. At the peak of the housing boom, at the end of 2005, real estate was 33.6 percent of household assets and stocks were 18.3 percent.
It has happened before, but never by this much
Stocks briefly overtook real estate in late 1999 and early 2000, at the height of the dot-com boom, when they reached 26.7 percent of assets. They pulled ahead again at the end of 2019, from late 2020 through 2021, and briefly in early 2024. Today’s share is far above any of those peaks.
The first episode is worth remembering. Household stock holdings were $13.7 trillion at the start of 2000. Three years later they were $7.7 trillion.
Why it matters
When more of people’s wealth is in stocks, their spending depends more on the stock market. Rising share prices make households feel richer and spend more, and falling prices do the opposite. At today’s levels, a 20 percent fall in stocks would wipe out about $14.8 trillion of household wealth, more than a quarter of the value of all the real estate households own.
The gains also went mostly to households that own a lot of stock. For the many families whose main asset is their home, the past year added far less.
The case against us
These shares move with prices. Much of the jump in the stock share comes from the rally itself, not from people buying more stock, and a market fall would shrink it quickly. Much of the stock is also held in retirement plans by people who tend not to sell when prices fall, which can soften the blow to spending. And the Fed revised its data in September, adding hedge funds and private credit, so figures published before then will not match.
What it means for your money
Check your own mix. After a long rally, stocks may make up a bigger share of your savings than you planned.
Spreading risk matters more. When so much household wealth rides on one kind of asset, so does the economy.
Housing is a weaker cushion. With mortgage rates above 7 percent, home values rose less than inflation over the past year.
What we are watching
15 October, 18:00 Brussels time: Freddie Mac’s weekly mortgage rate.
Late October: results from the biggest technology companies, the stocks behind much of the rally. Microsoft reports on 28 October.
10 December: the Fed’s next household wealth data, for July to September.
Educational research only. Not personalized investment advice. MB “MoatPeak Group”.