


If you look at the figures in detail, however, the standard explanation fails to stand up.
A comparison is currently circulating which states that European bank shares have outperformed the Magnificent Seven since the end of 2021. That is correct; however, it is almost always given with the wrong explanation, and it is the explanation that matters if you hold either of them.
Begin by looking at the results.
European banks achieved a return of +273.7% in euros from 31 December 2021 to 21 August 2026, with the payments being reinvested. The Magnificent Seven, weighted by their capitalisation, returned +105.2% in dollars and +98.6% in euros.
Currency differences account for only a small part of the gap. When the figures are looked at in local currencies, the difference is 168.5 percentage points, whereas for euro investors it is 175.1 points, which means that currency effects explain about 3.8% of the gap.
The banks suffered a smaller loss as a result. Their worst peak-to-trough decline was 25.5%, as compared with 43.9% for the weighted technology index and 49.5% for the equal-weighted one.
Let us now examine the results, since this is the main point.
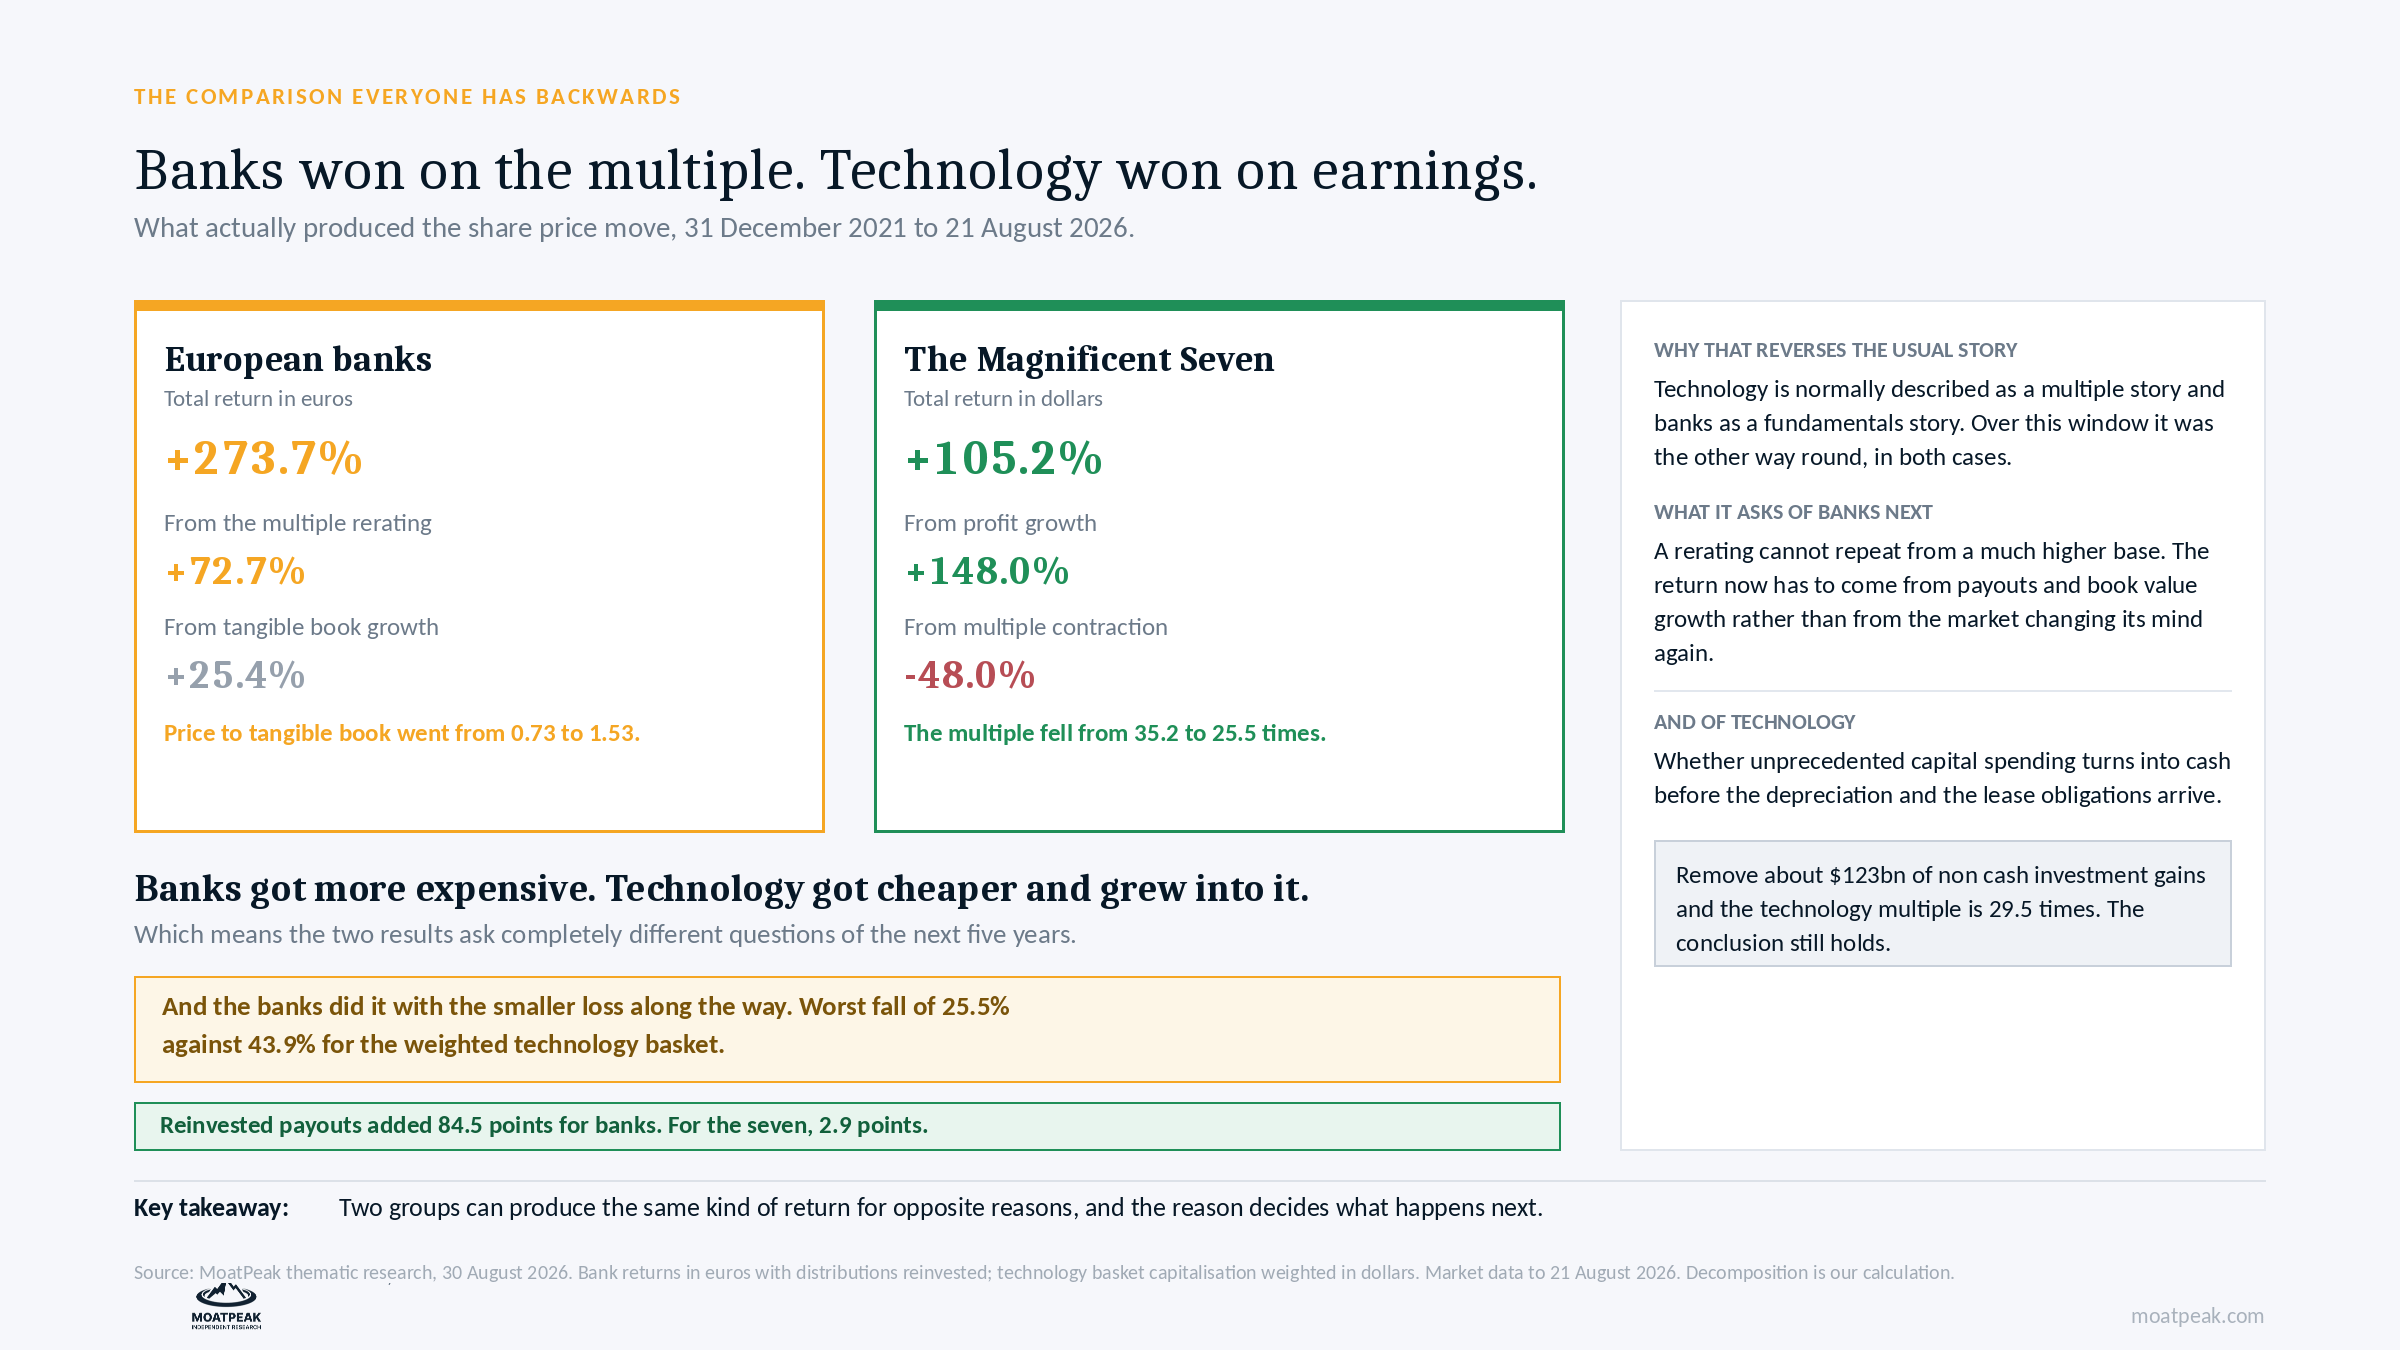
The tangible book value per share increased by about 1.30 times during that period, which amounts to roughly 5.9% per year. The price-to-tangible book multiple also rose to 2.12 times, starting from 0.73 and ending at 1.53. The price itself rose by 2.81 times.
If you break it down, 72.7% of the increase was due to the higher valuation and 25.4% was the result of growth in book value.
The total market value of the Magnificent Seven increased from $11.81 trillion to $23.11 trillion, which is almost double. Their reported profits rose from $335.8 billion to $906.9 billion, an increase of 2.7 times. At the same time, the price-to-earnings ratio fell from 35.2 to 25.5.
When split in the same way, 148% of the increase was due to higher profits, while multiple contraction amounted to a decrease of 48%.
To sum up, banks became more expensive whereas technology stocks became cheaper as their profits increased.
It is the contrary of the way that people typically describe these sectors, and this is not merely a result of rounding. If you take away the $123 billion of after-tax non-cash investment gains from technology profits, the price-to-earnings ratio would be 29.5 rather than 25.5. The primary conclusion remains unchanged.
Why how these returns were made matters for the next five years
The reasons for share price rises due to higher valuations and those caused by earnings growth are very different when it comes to what they imply for the future.
For banks the majority of the increase in valuation has already taken place; in order to see it again there would need to be a further large rise from a higher initial level. Future returns will probably be derived from dividends and from the growth in book value rather than from the market revaluing the shares. There is also a point which is often neglected: when the price is 0.9 times book value, buying back ninety euros’ worth of shares offsets a hundred euros’ worth of tangible capital. But when the price is between 1.5 and 2.5 times book value this advantage vanishes. The share buybacks which were valuable at a level of 0.73 times book value are not so at 1.53 times book value.
For technology companies, the key question is whether their spending will pay off. Capital spending was 56.4% of operating cash flow. Depreciation was $184 billion compared to $541 billion in capital spending, so much of the cost has not yet shown up in the accounts. Future lease commitments are close to $899 billion. With a free cash flow yield of 1.81%, the market is expecting about 18.3% annual free cash flow growth for the next ten years.
Both groups now have to show they are worthy, but in quite different ways.
There are three factors which make the argument in favour of banks more complicated, and it is important to refer to them.
The share prices have ceased following the earnings estimates. Between late May and mid-August the median ratio of the changes in the earnings estimates to the changes in the share prices was approximately 0.12. That is to say, the prices had moved about eight times faster than the figures underneath them.
The credit conditions are once again back to normal. The cost of risk in Europe has risen from 48 to 56 basis points, which represents the first increase in three years. The amount of Stage 2 loans is now 9.1%.
Rather than providing help, high interest rates are now causing difficulties. Although current accounts offer only 0.28%, term deposits pay 2.03%. The yield differential between the ten-year and two-year German bonds has decreased to 51 basis points, and mortgage demand has fallen by 15%.
Even though there are these difficulties, large European banks have one real structural advantage in that they give back between 5% and 8% of their market value to shareholders each year. In contrast, the Magnificent Seven return only 1.06%. During this period, the amount reinvested from distributions contributed 84.5 percentage points to bank returns, as against just 2.9 points for the Magnificent Seven.
A note about the popular chart being shared:
We were unable to reproduce the original comparison exactly. The decision as to whether to choose a fund or an index has a major impact. Our technology basket reaches about 205 on the same base, whereas a proxy for the STOXX Europe 600 Banks reaches 374 and the Euro Stoxx Banks, when measured in dollars, reaches 412.
The same general trend is true in all the versions, but the specific figures differ. A person who quotes a particular figure showing outperformance without naming the index has probably not checked which one they had used.
How the full report addresses these findings
The explanation given above makes clear what took place, but it does not indicate what you should purchase. The solution is not simply ‘banks’ or ‘technology’.
The sector is not the same anymore. Nowadays the companies trade at a price of about 1.0 to 2.5 times their tangible book value, and the variations between the individual stocks are larger than the sector’s average advantage over the Magnificent Seven. There is no evidence that supports the simple idea of buying the index.
The report reviews eleven European banks and the technology companies one by one. It covers where we would invest, where we would wait for a better price and what that price would be, which companies are good businesses but overvalued, and which ones we would avoid and why. It also explains why the main European bank fund is not a perfect substitute, since only 58.7% of it is actually invested in banks.
The market data is given as of 21 August 2026 and is dated accordingly.
The full thematic research is at moatpeak.com.
This content is based solely on educational research and does not provide any personal investment advice. MB “MoatPeak Group”.