


On 17 August, we published an article showing that the main price in the artificial intelligence bear case – the hourly rental cost of a chip – had not fallen and was actually rising. The next day, we explained that the reported drop in model output prices was really just a shift in what people were buying, not an actual price decrease.
Both of these opinions went against the crowd and were not easy to share. Since then, the daily data has strongly supported them.
What the monitor is
Our dashboard brings together token volumes and two price indices – one for model output and one for accelerator rentals – into a single score from 0 to 100, with 50 as neutral. It explains its weighting, removes data older than three days, and filters outliers before calculating. Anyone can check its methodology.
Our research team checks this dashboard every day. All the data comes from third parties: token volumes from OpenRouter and two independent price indices for model output and accelerator rentals. This is not an institutional product, and we would not make decisions based only on it. Still, it is transparent and updated daily, which makes it more reliable than most sources used by retail investors.
That difference is important for what comes next. We built the dashboard, but we do not create the prices it uses. We are not grading our own work here.
What it says today
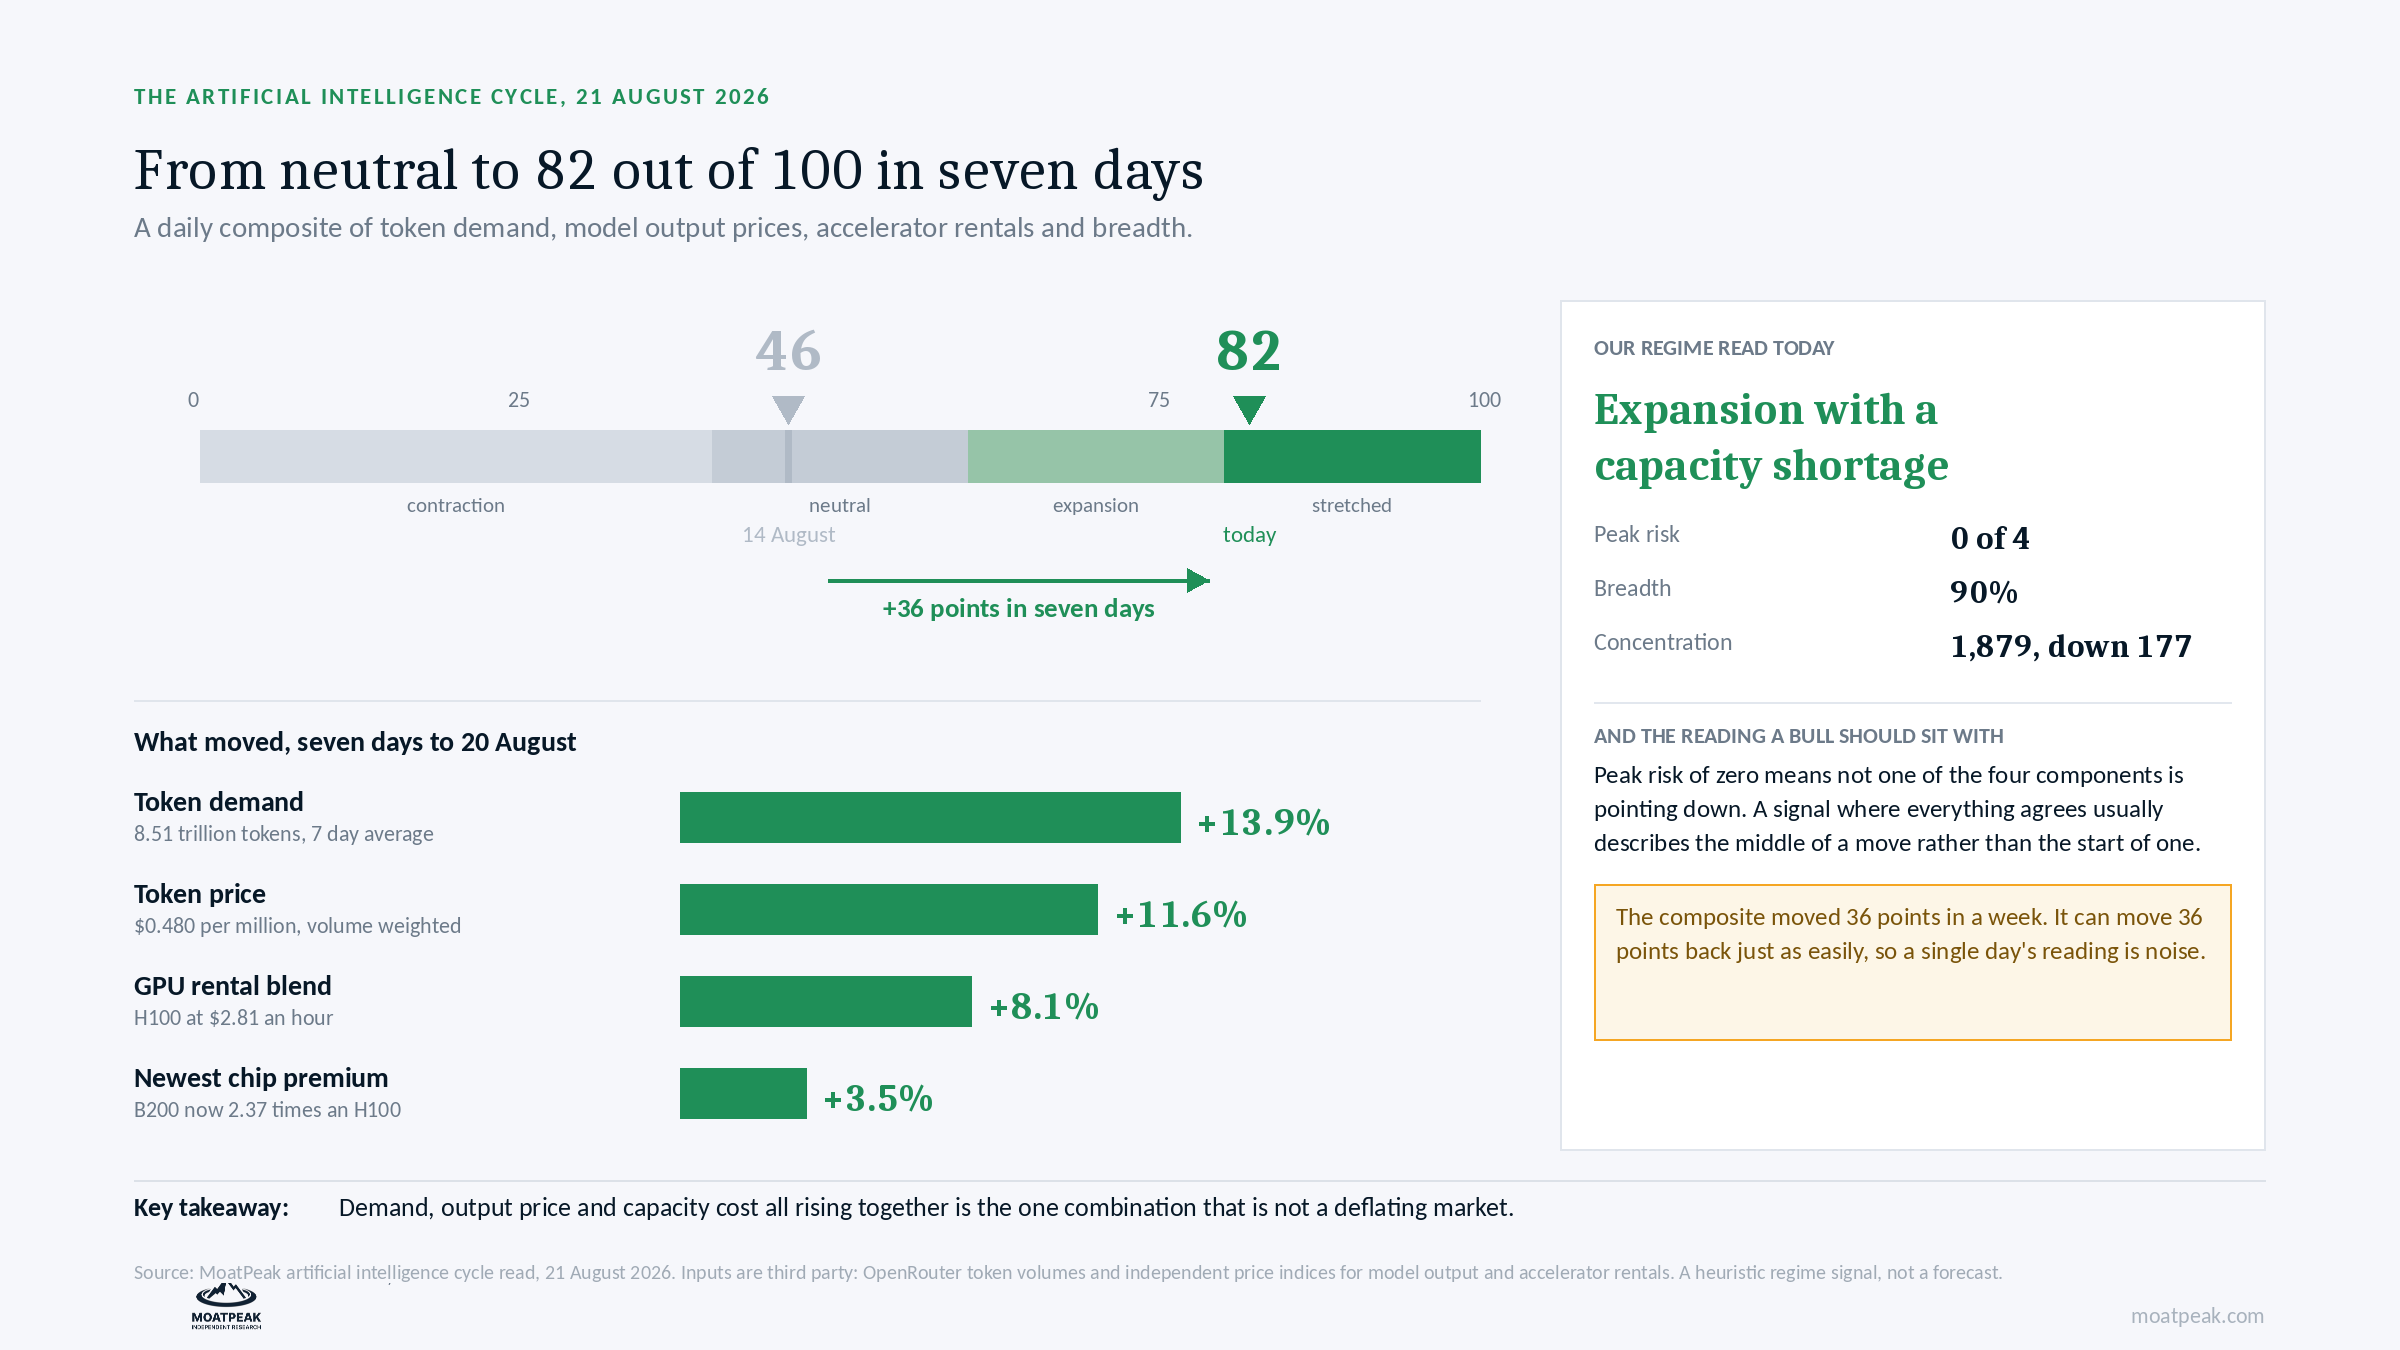
Right now, the market is in a phase called “expansion with a capacity shortage”. In our view, this means both demand and capacity costs are rising at the same time, which is the opposite of what most people have been saying.
Over the past week, token demand rose by 13.9%, the volume-weighted token price went up by 11.6%, the average GPU rental price increased by 8.1%, and the price gap between the newest chip and the mass-market chip grew to 2.37 times.
The composite score is now 82 out of 100. On 14 August, it was 46, which is about neutral. So, it has jumped 36 points in just one week.
The chip rental series, which is the part worth your time
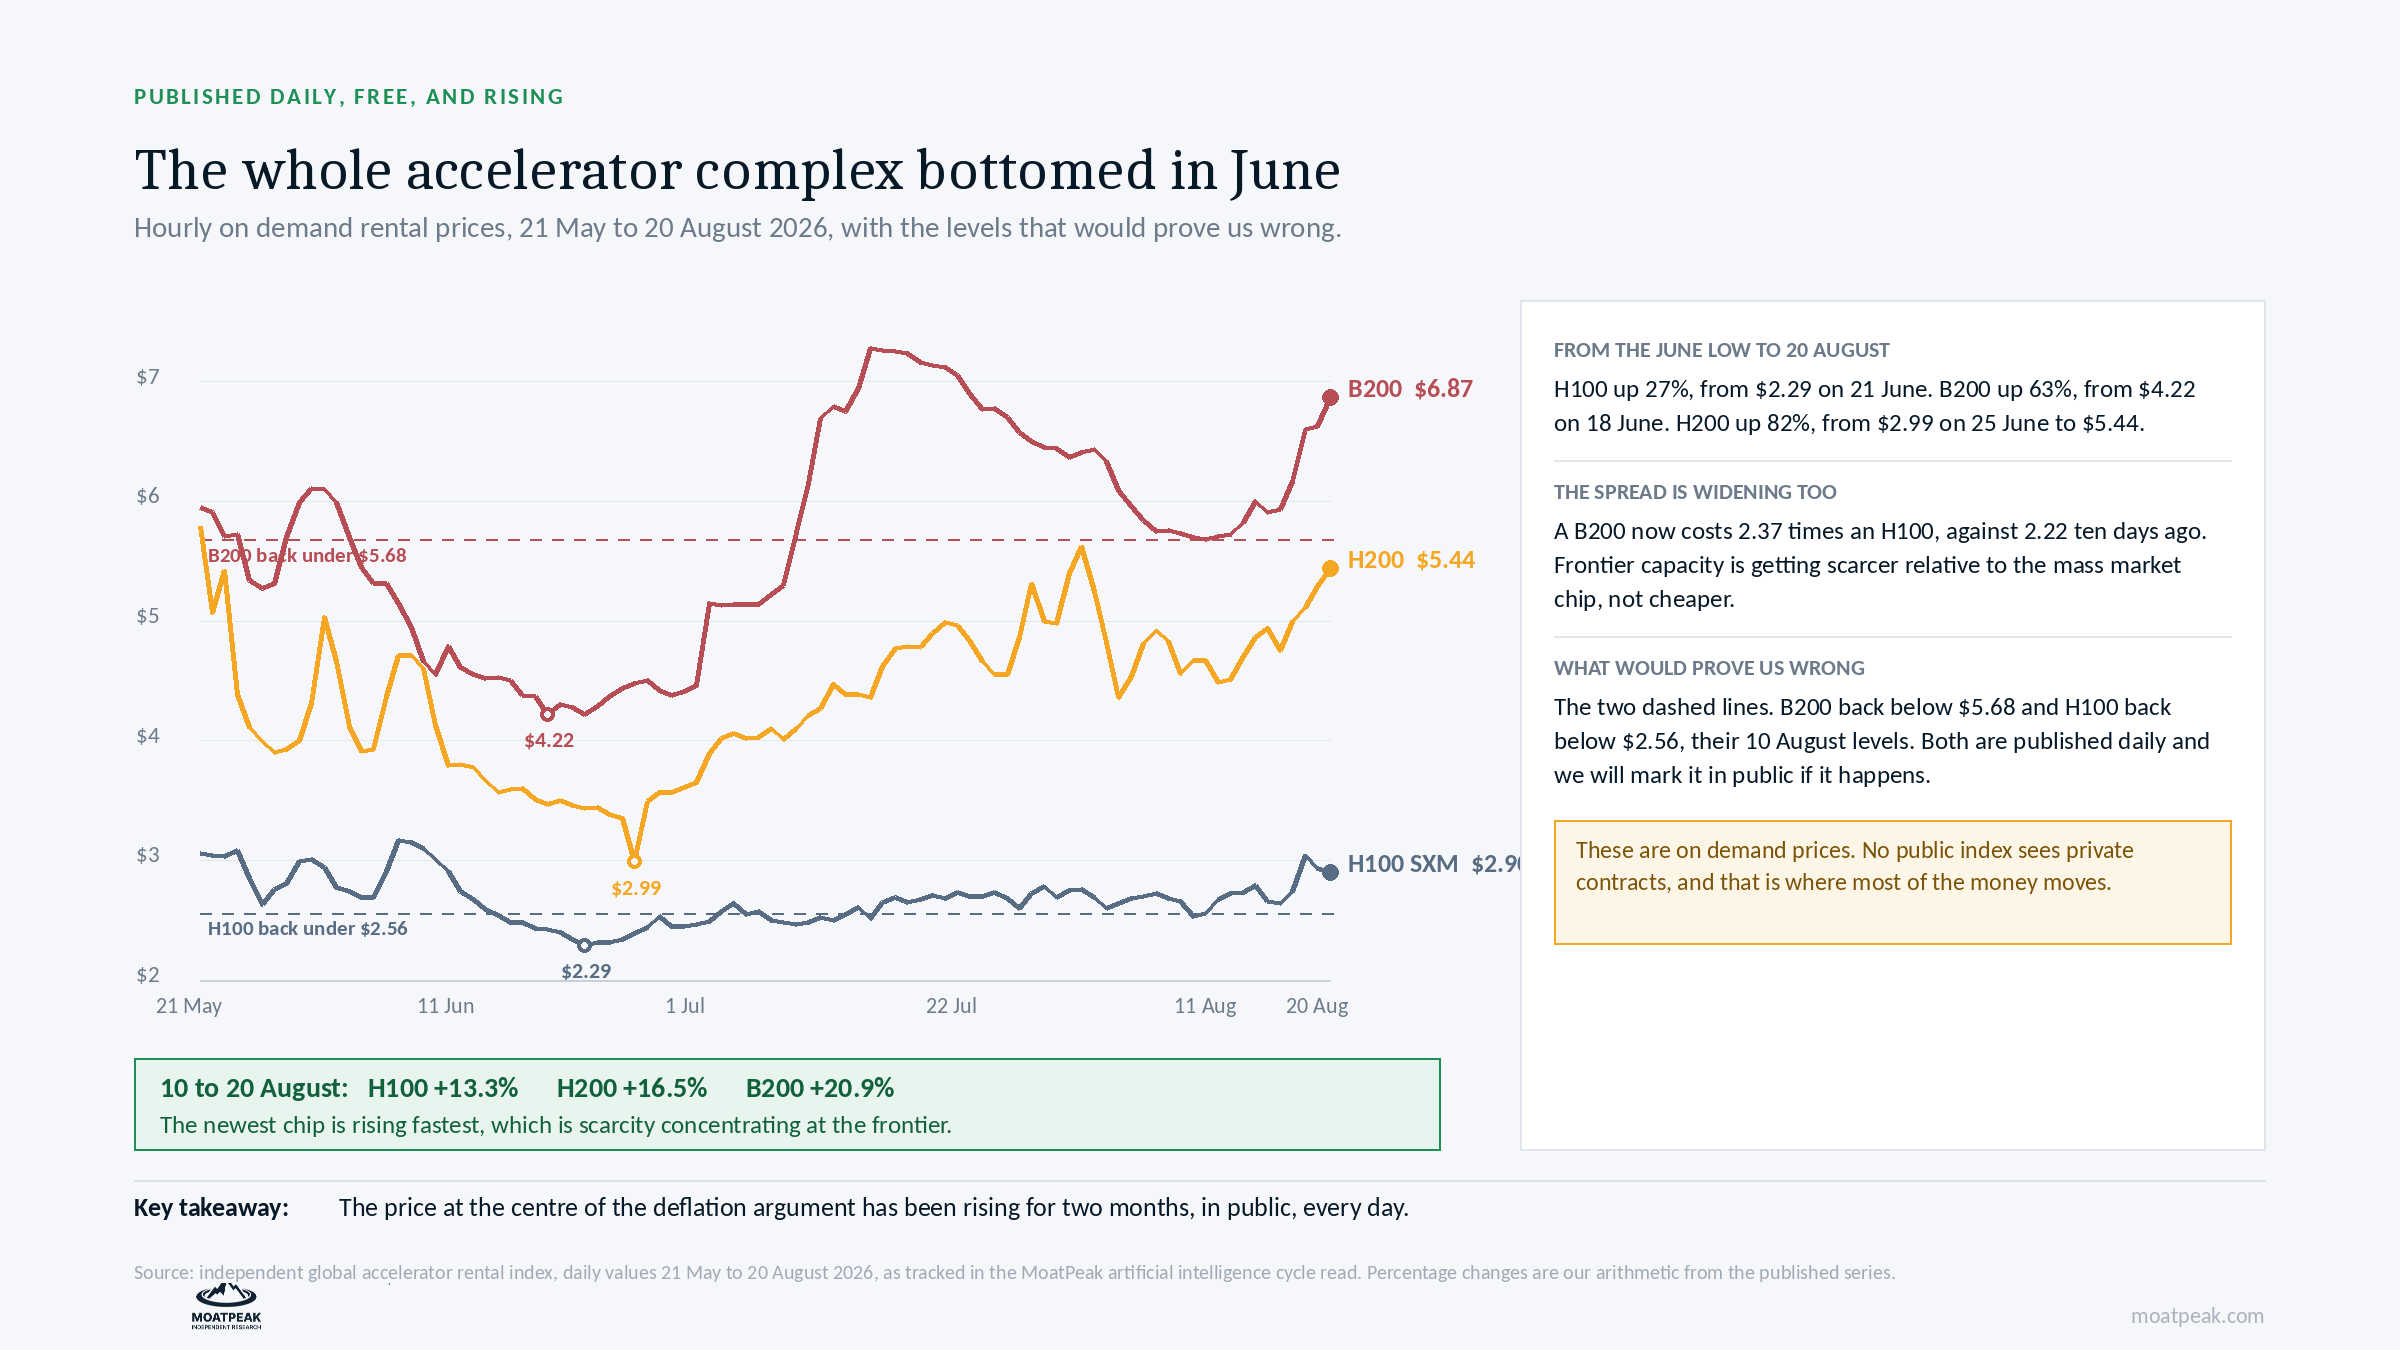
The dashboard shows daily hourly rental prices for three types of accelerator. If you look at the charts, you’ll see something that most reports have missed.
All three prices reached their lowest points in June: H100 was $2.29 on 21 June, B200 was $4.22 on 18 June, and H200 was $2.99 on 25 June.
From those lows to 20 August, H100 rose by 27%, B200 by 63%, and H200 by 82%.
This trend picked up speed in August. Between 10 and 20 August, H100 went up by 13.3%, H200 by 16.5%, and B200 by 20.9%. The newest chip is rising the fastest, which means scarcity is growing at the leading edge instead of getting better.
The three things this does not tell you
We would rather share these points openly now than have someone else point them out later.
The monitor cannot track private contracts. It only shows on-demand prices. Large customers with multi-year deals pay very different rates, and that is where most of the money is spent. So, any conclusions here only apply to the spot market.
The token measure depends on the mix of tokens. We want to be clear about this: the volume-weighted price combines price changes within each lab with changes in how much each one is used. This is the same issue we talked about on 18 August.
A composite score that can move by 36 points in a week is very sensitive. It could just as easily swing back, so we treat any single day’s reading as noise.
And the reading that should make a bull uncomfortable
At the moment, peak risk is zero out of four. None of the four components are moving down.
That might sound like great news. But in reality, when everything lines up, it usually means we are in the middle or near the end of a trend, not at the start. The key thing to watch for is when two components turn down at the same time. Our tool needs this to happen for two days in a row before it updates.
What a private investor can actually do with this
There are four things you can do with this information, and none of them require making a trade.
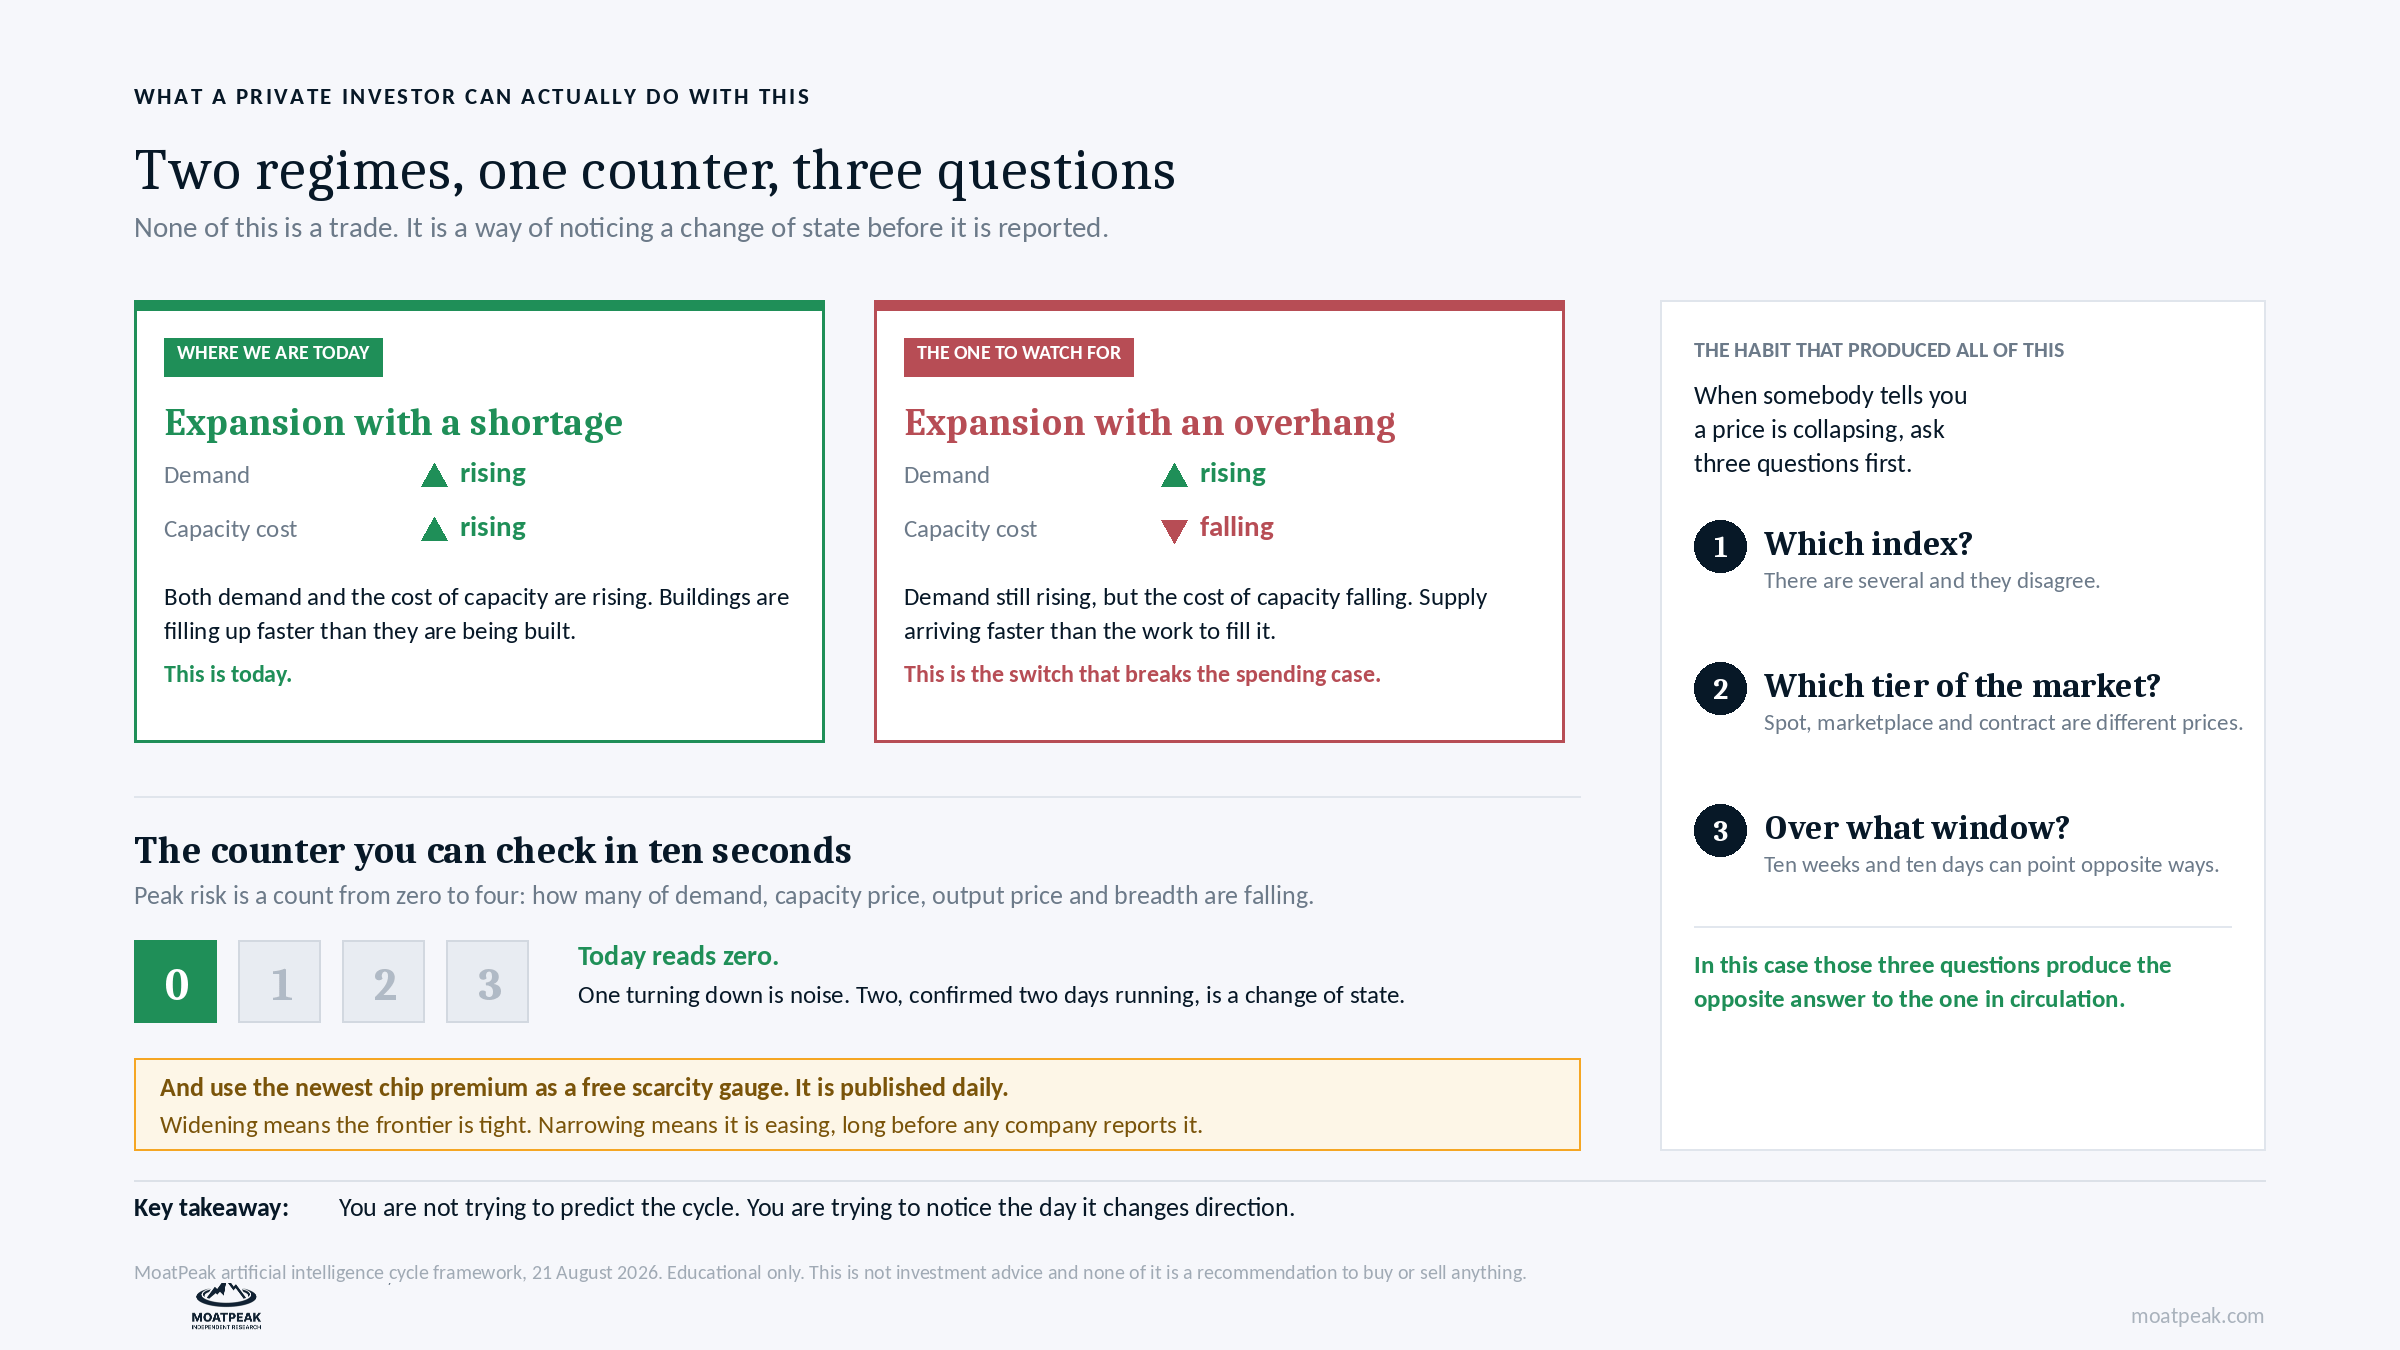
Know the two important phases. “Expansion with a shortage” means both demand and capacity costs are rising. “Expansion with an overhang” means demand is rising but capacity costs are falling. The second case weakens the spending argument, since it means supply is growing faster than demand. Right now, we are in the first phase. Watch for any change.
You can use the price gap between the newest chip and older ones as a free way to measure scarcity. This data is published every day. If the gap gets bigger, the market is tight. If it gets smaller, scarcity is easing, and you will see this before companies report it.
Check the number of negative loops. The count ranges from zero to four and only takes a few seconds to check. If two loops turn down and this is confirmed for two days, it signals a real change. If only one turns down, it is just noise.
Keep using the habit that led to these insights. When someone says a price is collapsing, ask three questions right away: Which index? Which part of the market? Over what time period? In this case, those questions lead to the opposite conclusion from what most people are saying.
What would prove us wrong
The B200 falling back below $5.68, its 10 August level, and the H100 back under $2.56. Both are published daily and we will mark it in public if it happens.
Our full work on which companies sit where in this cycle is at moatpeak.com.
Educational research only. Not personalized investment advice. MB “MoatPeak Group”.