


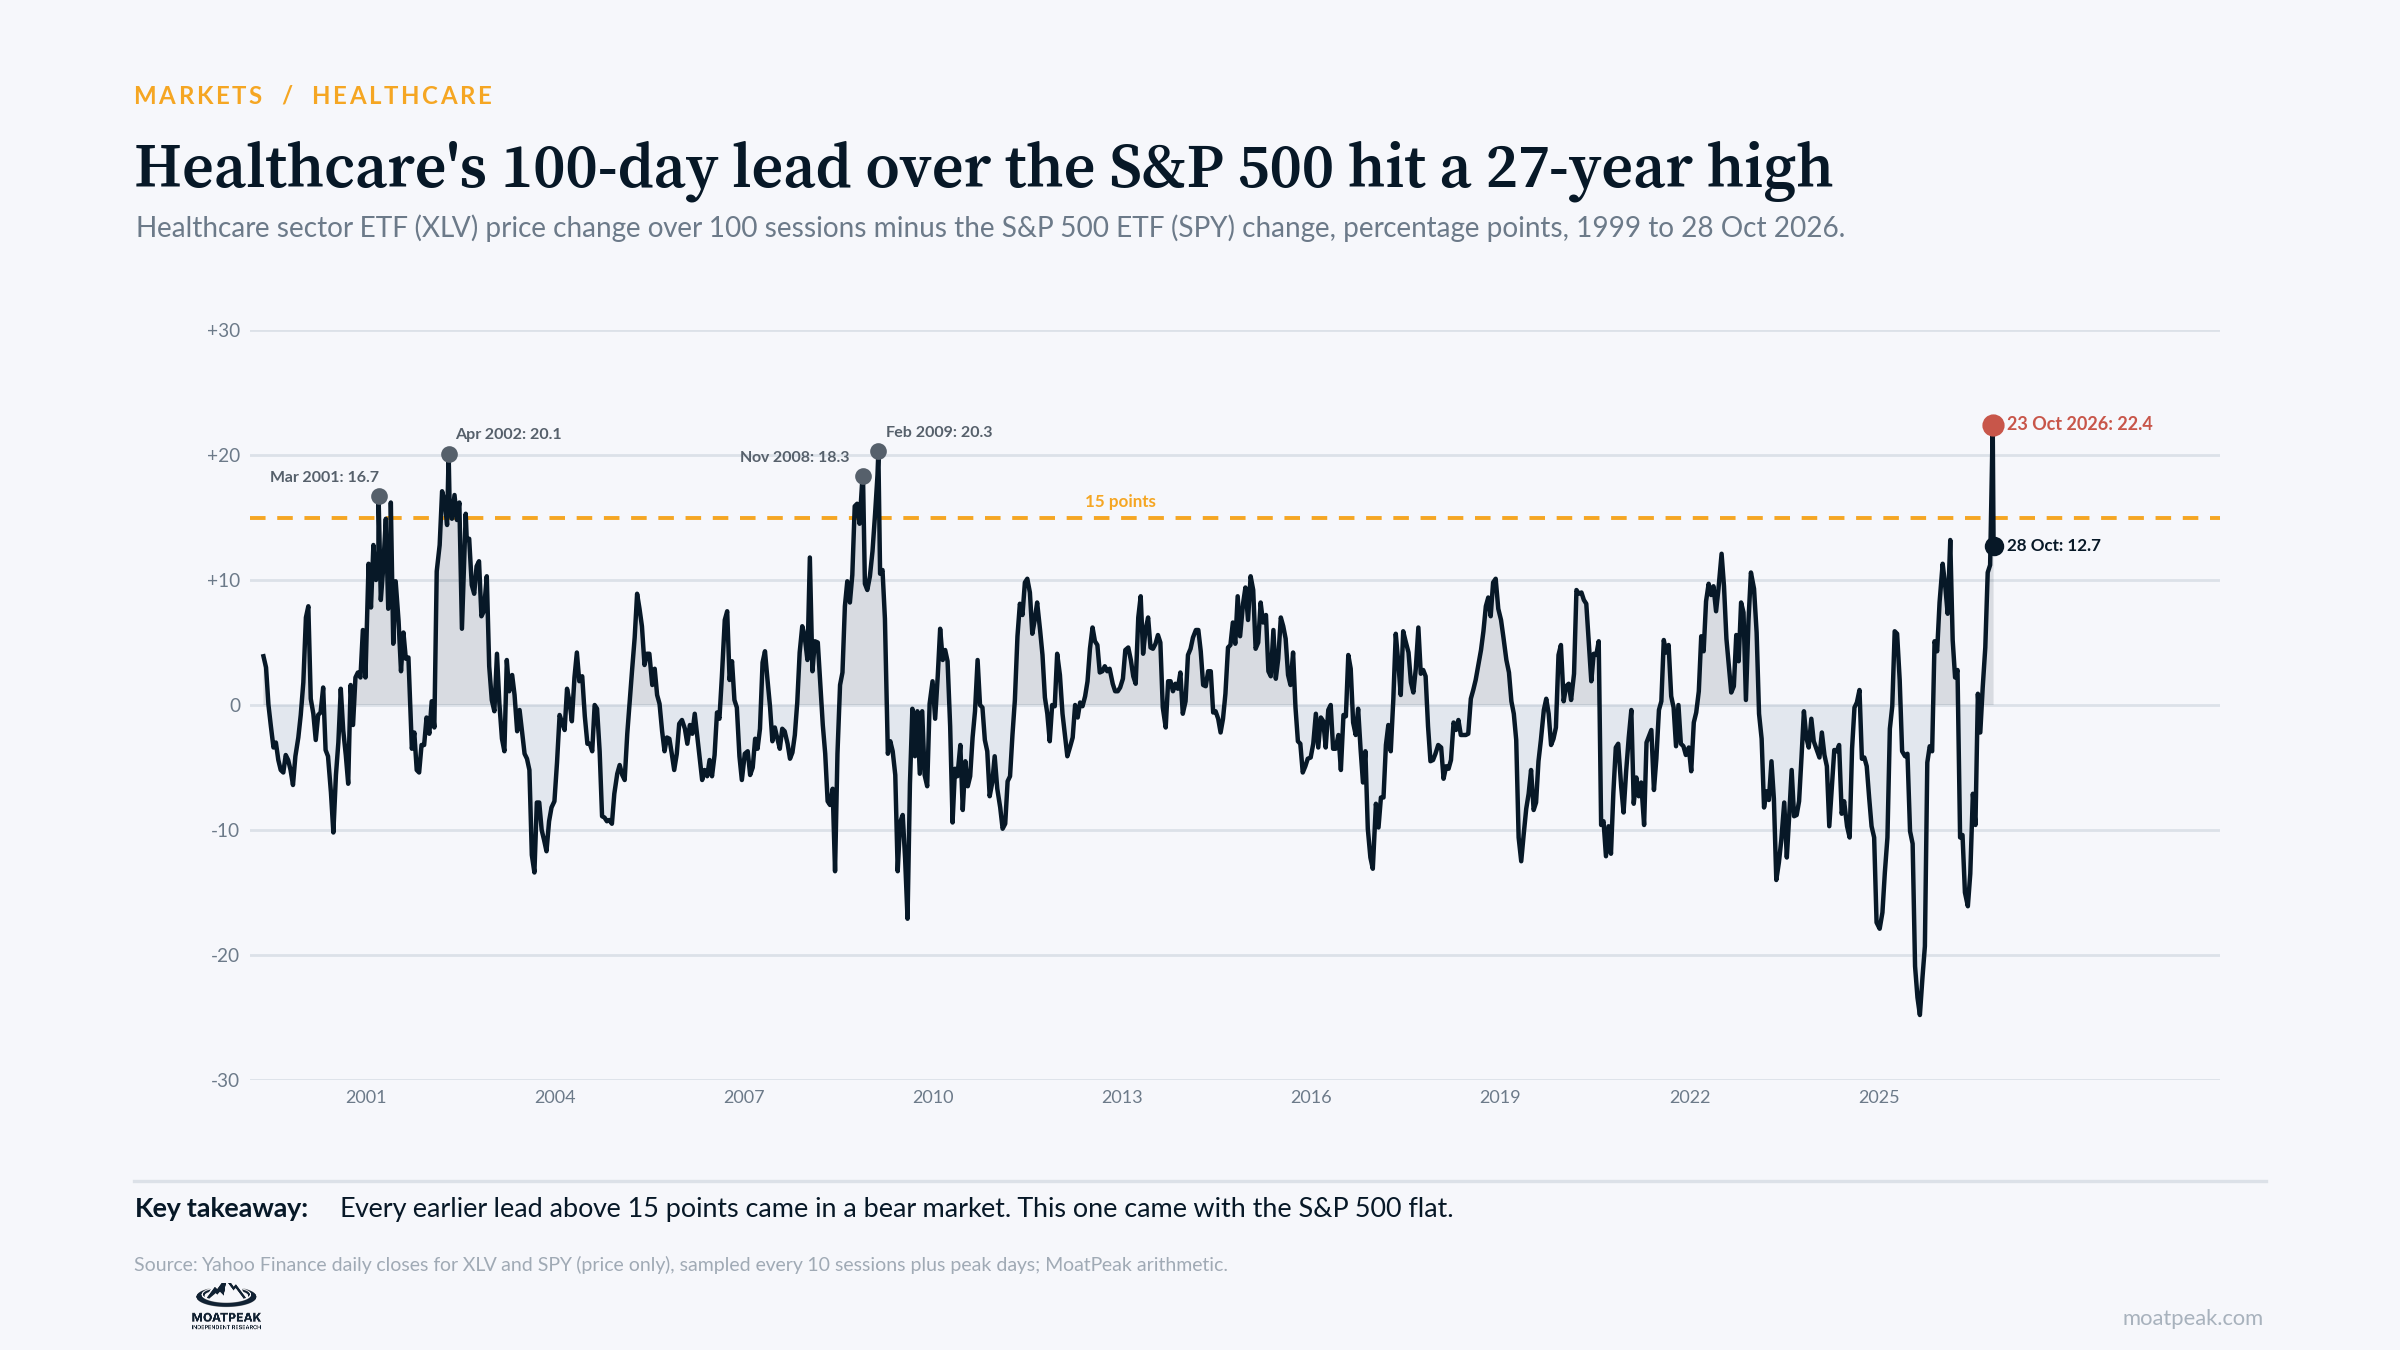
Healthcare has become this autumn’s favorite trade. Over the 100 sessions to 23 October, the Health Care Select Sector SPDR fund (XLV) gained 22.5 percent, while the S&P 500 ETF (SPY) was flat. That 22.4-point gap is the largest since our data began in 1999, shortly after the fund launched.
Records like this deserve a second look, because they depend on where the measurement starts.
Where the window starts
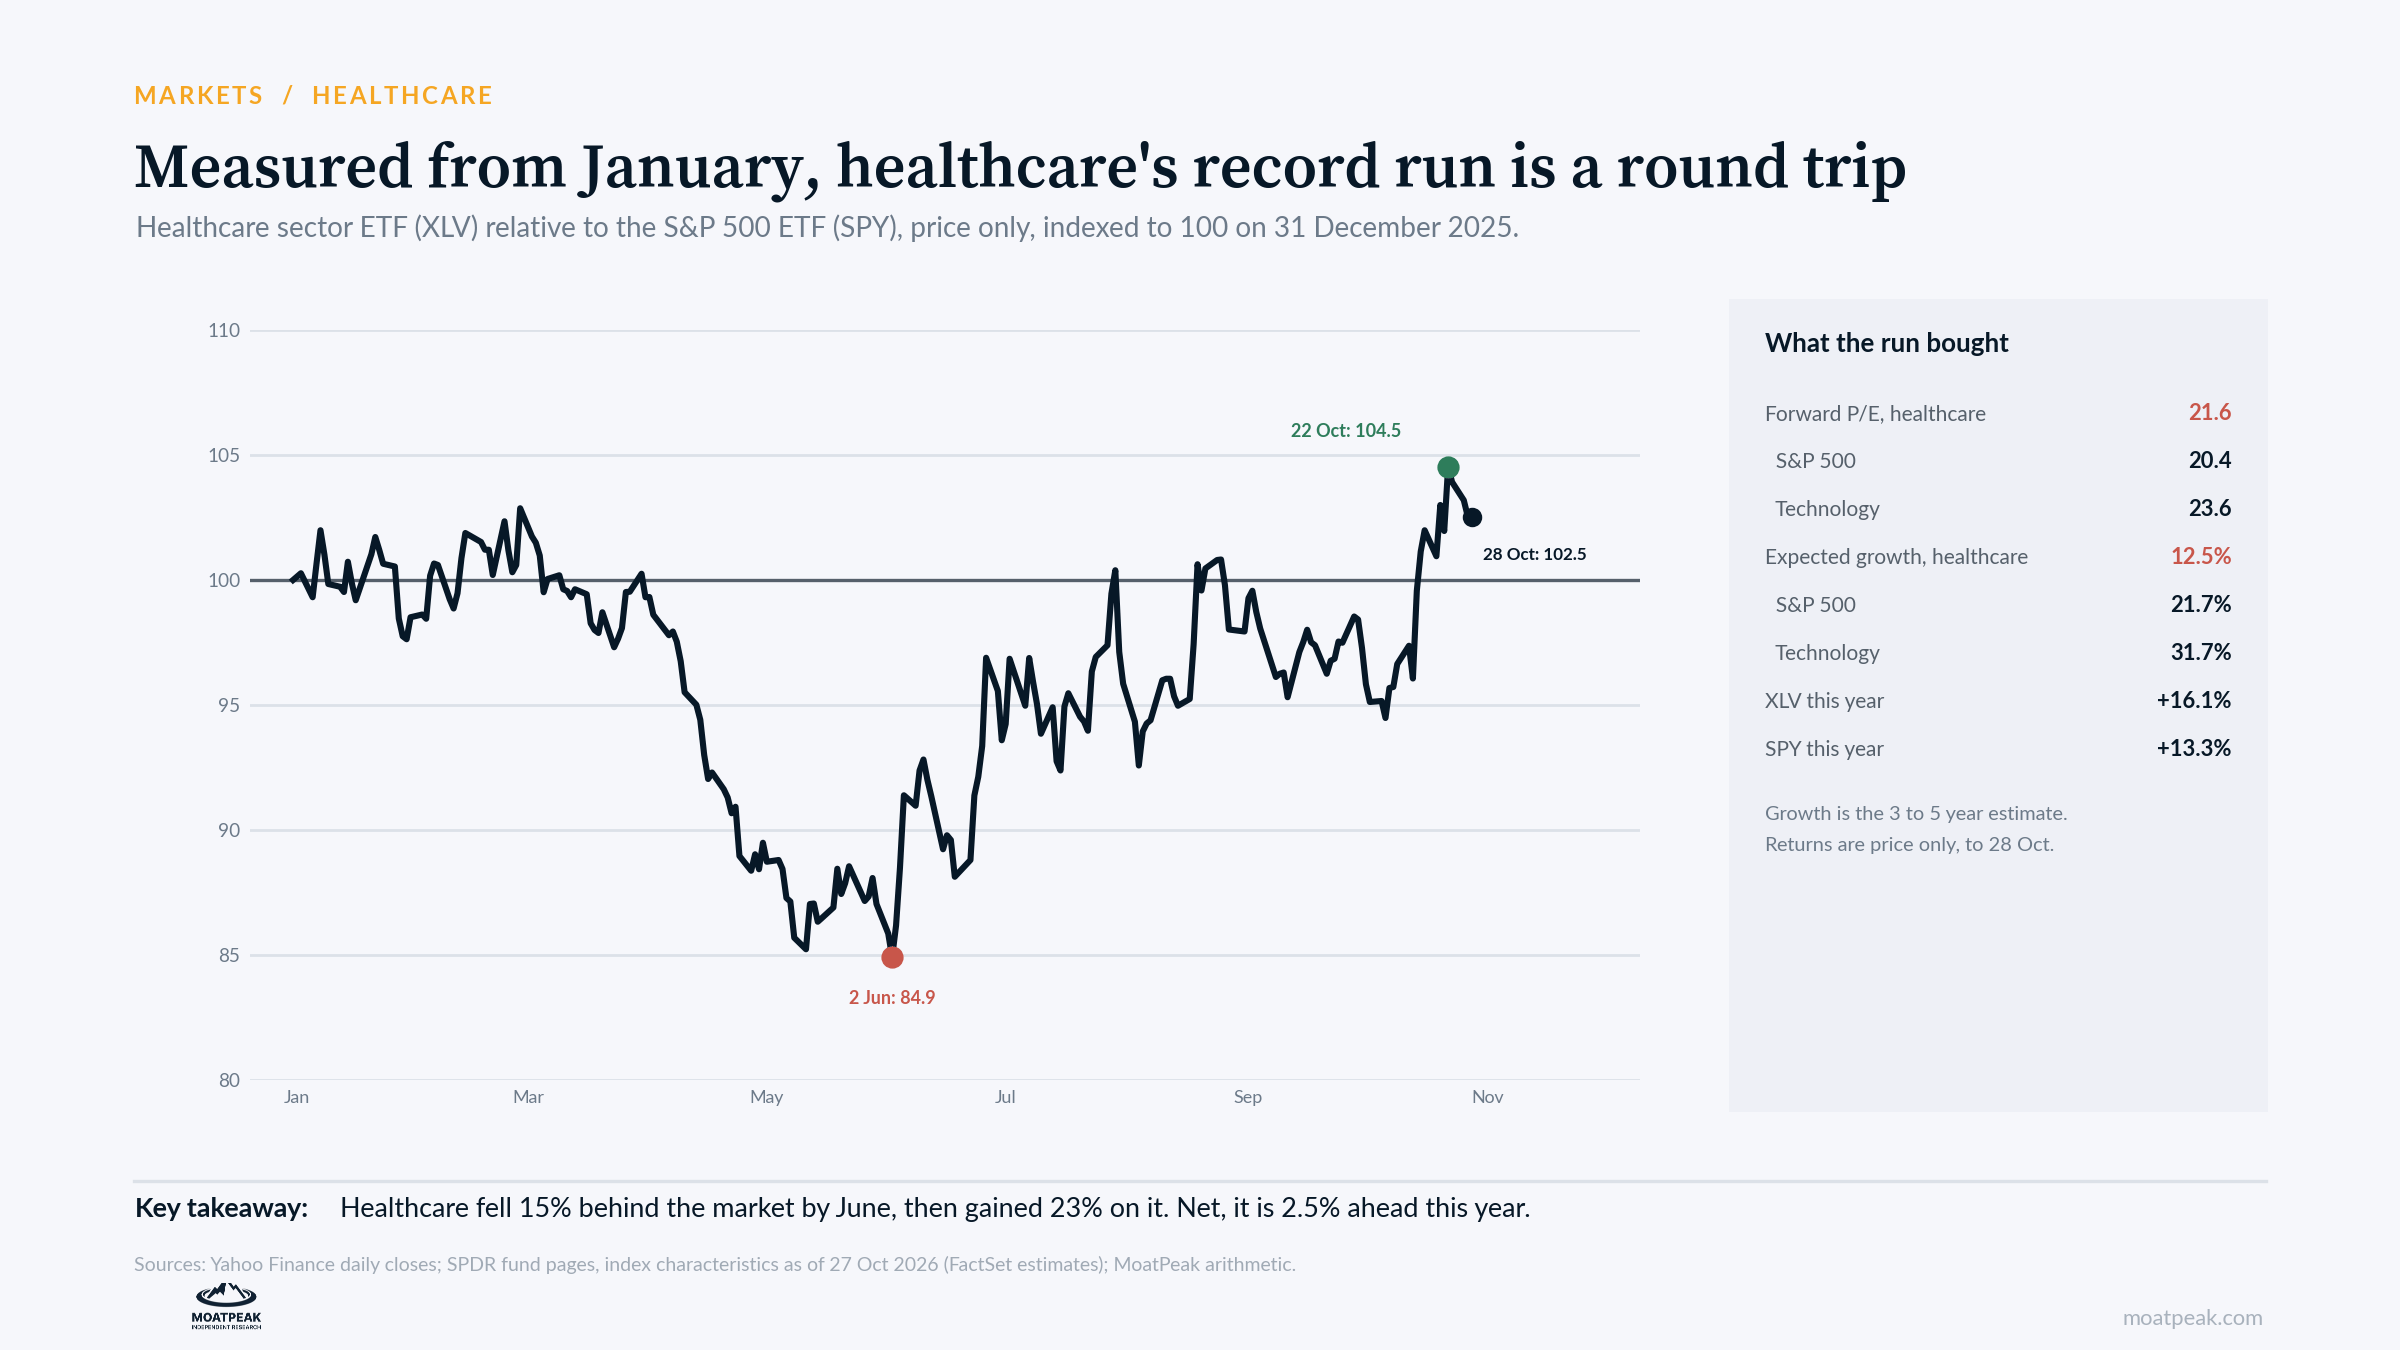
A 100-session window that ends in late October starts in early June. That was healthcare’s worst point of the year against the market. Between 1 January and 2 June, the sector fell 15 percent behind the S&P 500. Since then, it has gained back all of that and more.
Measured from the start of the year, the picture is far more modest. Through 28 October, XLV was up 16.1 percent and SPY 13.3 percent, leaving healthcare 2.5 percent ahead in relative terms.
The 100-day gap has also shrunk quickly, to 12.7 points by 28 October. Very little of that came from healthcare falling. From 23 to 28 October, XLV barely moved while SPY rose 1.6 percent. Most of the drop came from the window moving past the June low.
What the run bought
The rally was broad. All 10 of the fund’s largest holdings rose between 2 June and 28 October, from 7.7 percent for UnitedHealth to 46.1 percent for Thermo Fisher. Eli Lilly, almost 16 percent of the fund, rose 21.1 percent.
Valuations followed. Using FactSet estimates published on the sector funds’ pages as of 27 October, healthcare trades at 21.6 times expected earnings for the next year, against 20.4 for the S&P 500 and 23.6 for technology. Analysts expect healthcare earnings to grow 12.5 percent a year over the next three to five years, against 21.7 percent for the S&P 500 and 31.7 percent for technology.
Put simply, investors now pay more for a dollar of healthcare earnings than for a dollar of the market’s, while expecting a little more than half the growth.
What history says
Before this year, XLV had led SPY by more than 15 points over 100 sessions in only two stretches: 2001 to 2002 and 2008 to 2009. Both were bear markets, and healthcare won by falling less. At the February 2009 peak, XLV was down 12.9 percent over 100 sessions, while SPY was down 33.2 percent.
What came next depended on the market. In 2001 and 2002, stocks kept falling, and healthcare stayed ahead over the following year: by 10.2 points after the March 2001 peak and by 7.4 points after the April 2002 peak. In 2009, the market turned, and healthcare trailed the S&P 500 by 19.4 points over the next year.
This time there is no bear market. The S&P 500 was flat over the 100 sessions, and on 28 October it closed less than 1 percent below its 6 October record. Healthcare’s lead came from rising while the market went nowhere.
Our read
The record is real, but most of it is a recovery from a bad first half, and much of it arrived in a few weeks.
Healthcare’s best weeks were technology’s worst. Between 6 and 22 October, XLV gained 8.5 percent while the technology sector fund (XLK) fell 9.7 percent. When technology bounced 4.2 percent over the next three sessions, healthcare stood still. That is how a defensive sector becomes a momentum trade. Money that rotated in on technology’s bad news can rotate back out on its good news.
We would not chase it. Healthcare’s defensive appeal is real when markets fall. At 21.6 times forward earnings with 12.5 percent expected growth, it is priced for more than defense.
The case against us
Healthcare had fallen far behind by June. The rally may simply have closed that gap, and a 2.5 percent lead for the year is hardly a bubble.
The comparison with the S&P 500 depends on its expected growth of 21.7 percent, which leans heavily on technology’s 31.7 percent. If those estimates prove too high, healthcare’s slower but steadier growth may deserve its premium.
If the market falls from here, history favors healthcare. In 2001 and 2002, its lead held.
Our method has limits. We use ETF prices rather than the sector index, and a 100-session window. Different windows give different answers, which is part of our point.
What it means for your money
Check where a record starts. A 100-day lead measured from the year’s low says as much about the low as about the rally.
Know what you pay for protection. If you own healthcare as a hedge, its valuation premium is the cost of that hedge.
Rebalance rather than chase. If the run has made healthcare a bigger slice of your portfolio, trimming it back to your target weight requires no forecast.
What we are watching
The XLV to SPY ratio: it stood at 102.5 on 28 October, down from 104.5 on 22 October (31 December 2025 = 100). A fall below 100 would erase the year’s lead.
Technology’s rebound: a sustained recovery in AI stocks is the main risk to the rotation into healthcare.
Educational research only. Not personalized investment advice. MB “MoatPeak Group”.