


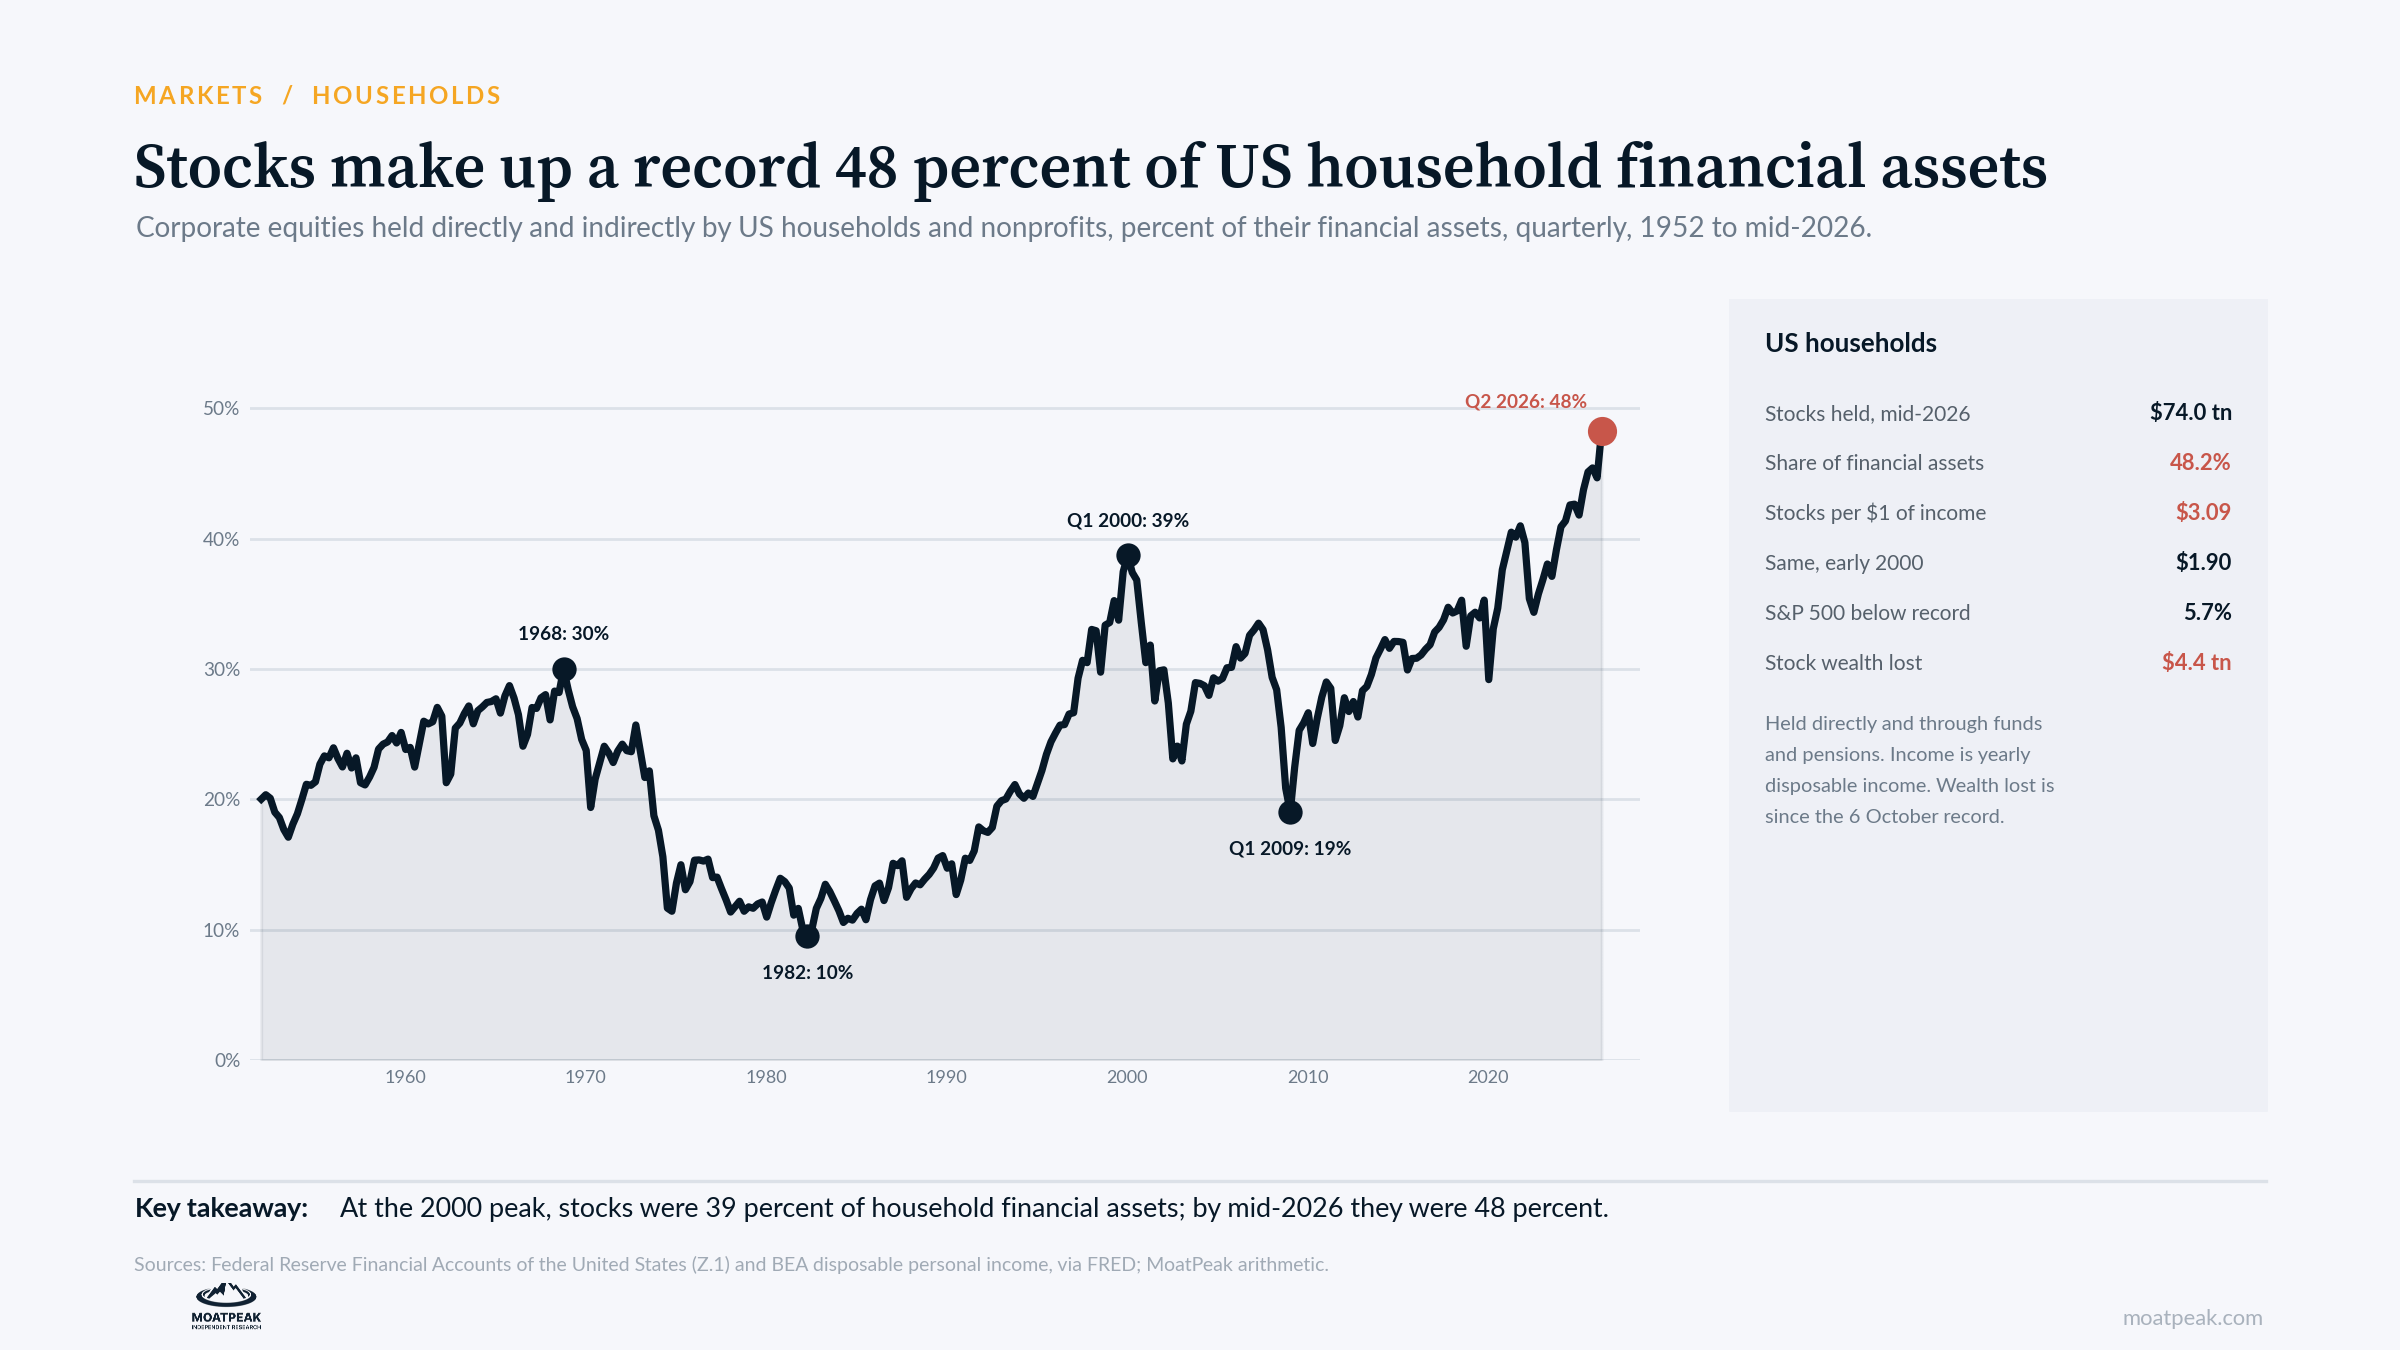
American households have never had more of their savings in the stock market. In mid-2026, stocks held directly and through funds and pensions made up 48.2 percent of their financial assets, according to the Federal Reserve’s financial accounts. At the dot-com peak in early 2000, the share was 38.7 percent.
That makes the question after the 5 November selloff a fair one: how much of the economy now rides on share prices?
The exposure is a record
Households held $74.0 trillion of stocks at the end of June. That is $3.09 for every dollar of yearly disposable income, against $1.90 in early 2000 and $2.60 at the end of 2021.
A 10 percent move in stocks now changes household wealth by about 31 percent of a year’s income. In 2000, the same move was worth 19 percent.
What the drop has cost so far
Scaling the June holdings by the S&P 500, household stock wealth peaked at about $77.2 trillion on 6 October. The 5.7 percent fall to the 6 November close has taken about $4.4 trillion off that.
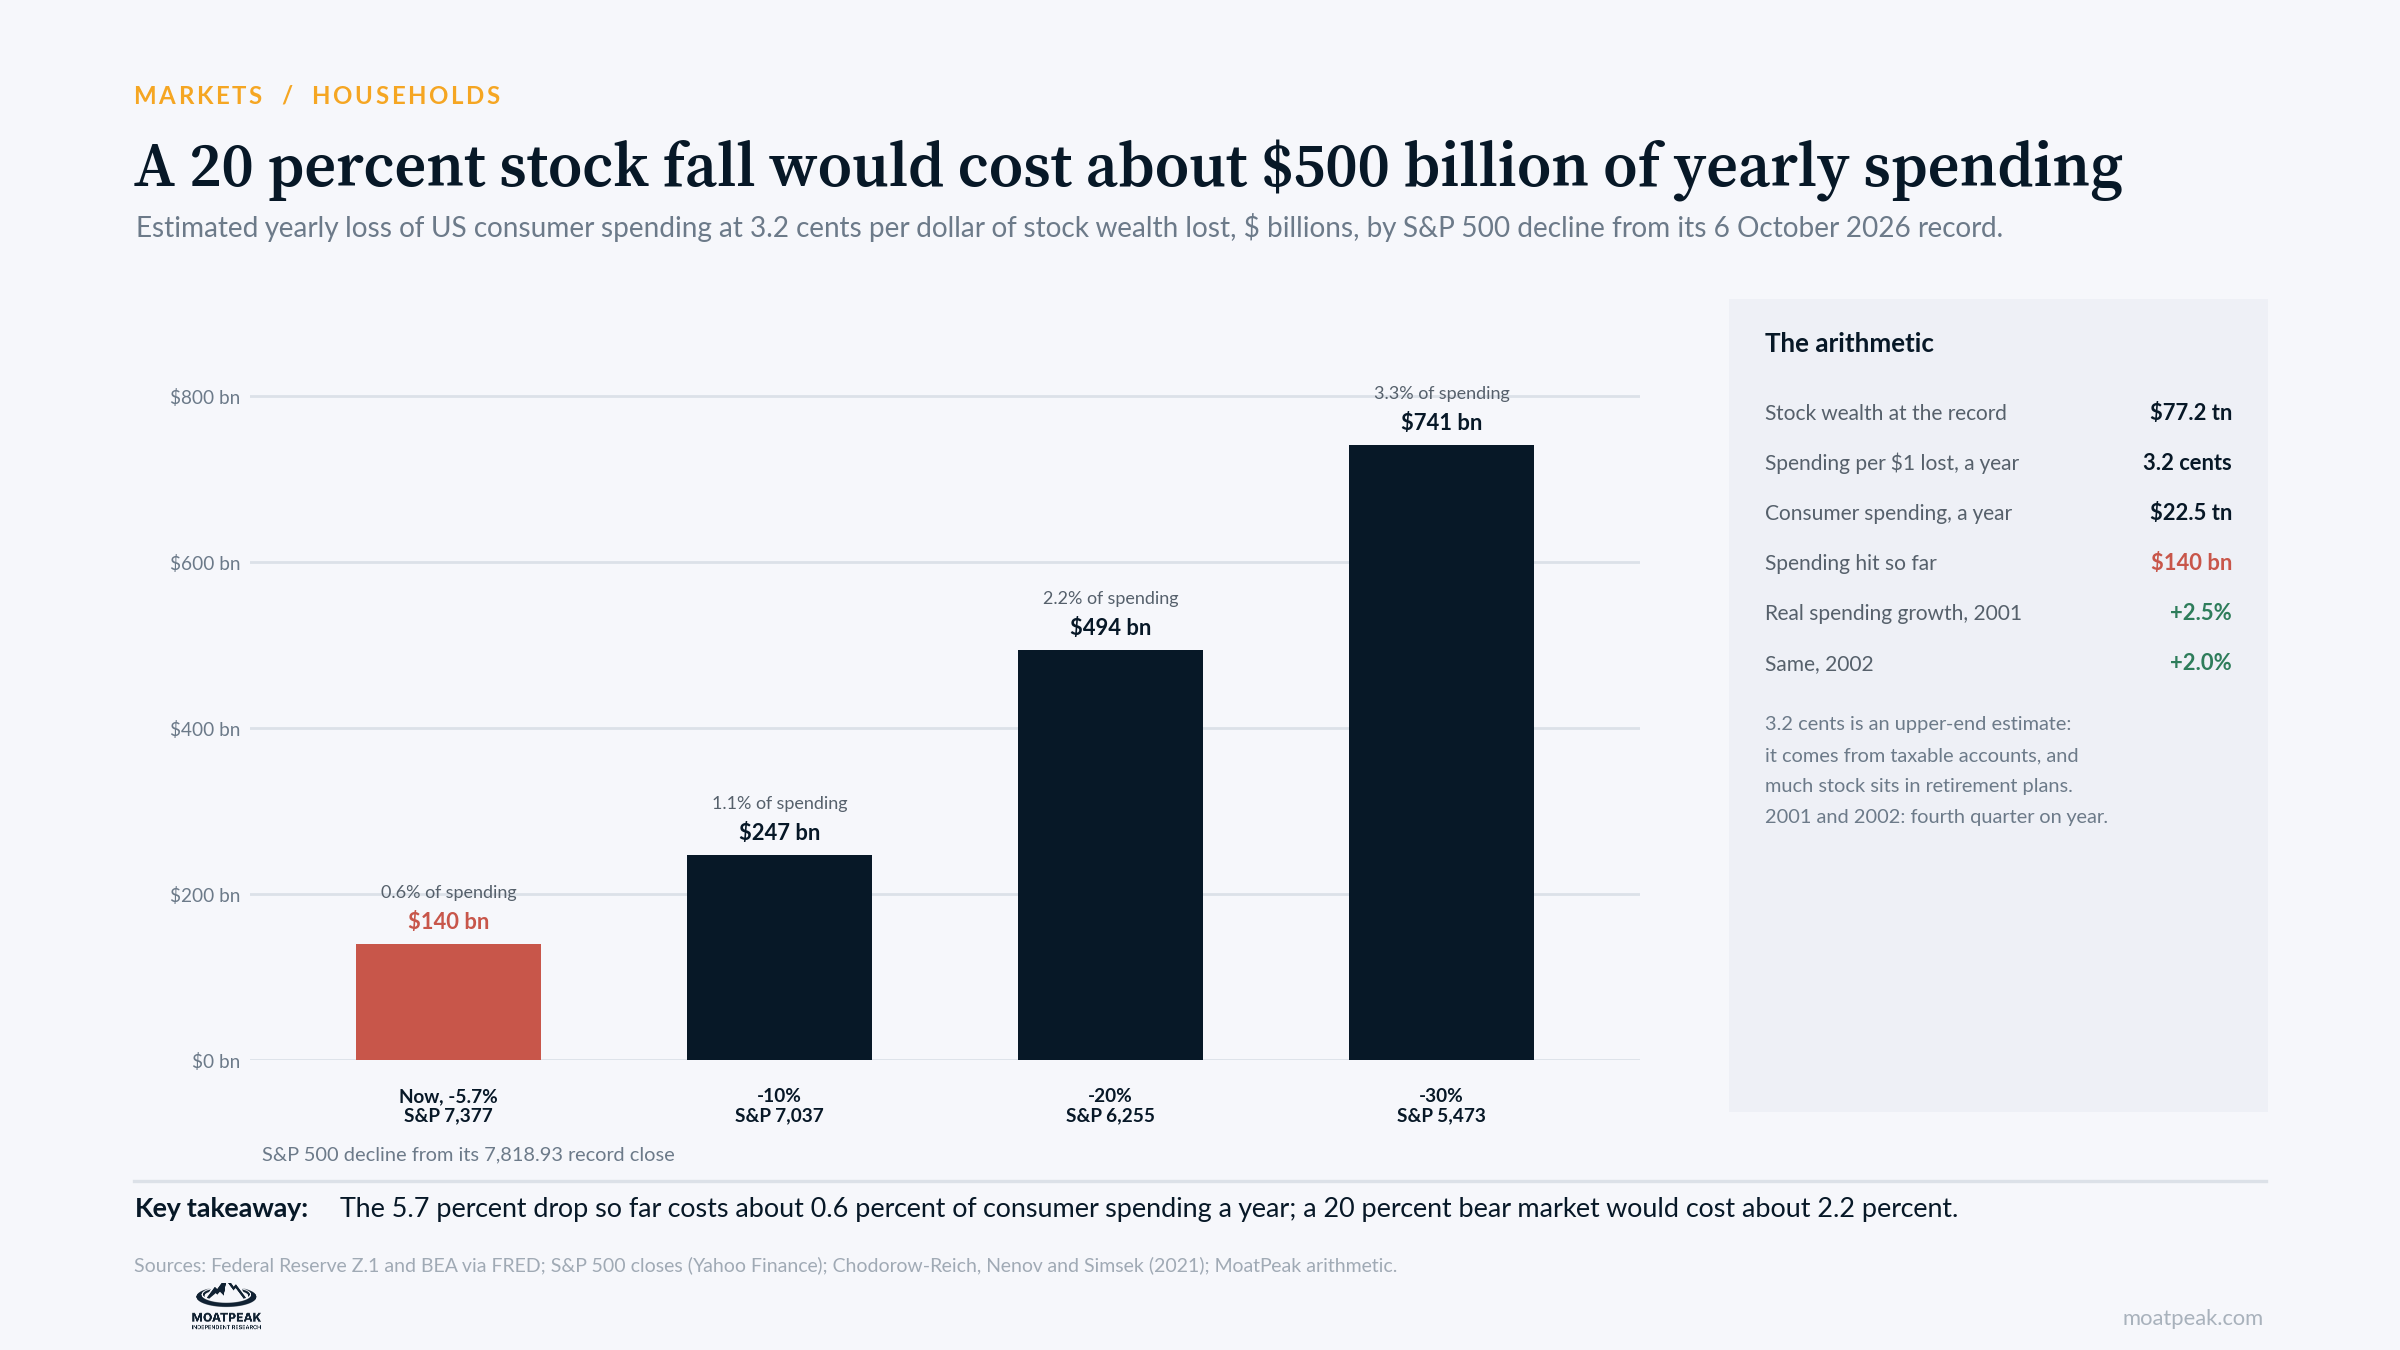
A 2021 study in the American Economic Review found that each dollar of stock wealth moves yearly consumer spending by 3.2 cents. On that basis, the drop so far would cut spending by about $140 billion a year, or 0.6 percent of the $22.5 trillion Americans spend.
That is likely the high end. The study measured wealth in taxable accounts, but much of the stock households own sits in pensions and retirement plans, which people are slower to spend from.
Where it starts to matter
The impact grows as stocks fall. A 20 percent decline from the record, to about 6,255 on the S&P 500, would take roughly $500 billion a year from spending, or 2.2 percent of the total. A 30 percent fall would take about $740 billion.
The last time stocks fell that far, after 2000, real consumer spending kept growing: by 2.5 percent in the year to the fourth quarter of 2001 and by 2.0 percent the year after. Household exposure to stocks, measured against income, was then about 60 percent of what it is now.
Our read
So far, the selloff is a modest drag on spending. Payrolls grew by 165,000 in October, and income growth matters more for spending than a 6 percent dip in stocks. The risk is a deeper fall. With exposure at a record level, a bear market would hit spending harder than in 2000, starting with wealthier households that own most of the stock.
The case against us
The 3.2 cent estimate may be too low for the current market. More households now own shares directly, many through trading apps, and their spending may react faster than the study’s sample did.
The 2000 comparison may also flatter the present. Back then, the Fed cut rates sharply as stocks fell. This year, it raised its target range in September.
What it means for your money
Watch the level more than the headlines. Below about 6,255 on the S&P 500, 20 percent under the record, the spending drag rises above 2 percent by our arithmetic.
Expect discretionary spending to move first. Travel, luxury and other big-ticket purchases by wealthier households tend to react before staples.
Don’t count on a quick rescue from rates. The Fed’s last move, in September, was a hike.
What we are watching
The next monthly spending reports: whether discretionary spending slows after the fall from October’s record.
The Fed’s financial accounts for the third quarter, due in December: the next official reading of household stock wealth.
6,255 on the S&P 500: our line for a 20 percent bear market.
Educational research only. Not personalized investment advice. MB “MoatPeak Group”.