


On 14 October, the Bureau of Labor Statistics reported that consumer prices rose 0.6 percent in September. Annual inflation climbed to 3.7 percent from 3.4 percent, and gasoline alone jumped 9.1 percent in September. The 10-year Treasury yield spiked to about 5.33 percent after the release.
Then it fell. By the next day, it had touched about 5.04 percent. On 20 October, it closed at 5.12 percent, 19 basis points below its 5 October close of 5.31 percent.
Hot inflation is supposed to push yields up. The usual explanations for the reversal are short covering, a flight from tech stocks into safety and strong demand at Treasury auctions. Each probably played a part. We think a simple split of the 10-year yield shows what the market is pricing.
Split the yield in two
A 10-year Treasury yield has two parts. One is the real yield, which you can see on inflation-protected Treasuries, called TIPS. The other is breakeven inflation, the gap between the two yields, which is roughly the inflation rate bond buyers expect over the next ten years.
Since the end of August, breakeven inflation has stayed between 2.31 percent and 2.40 percent. It was 2.35 percent on the day of the CPI report and 2.35 percent on 20 October. Through a Fed rate hike, $6 diesel and a hot CPI report, bond buyers’ inflation expectations hardly moved.
Real yields did the moving. From 31 August to 5 October, the 10-year yield rose 56 basis points, and 51 of them came from the real yield. From 5 October to 20 October, it fell 19 basis points, and 18 of them came from the real yield.
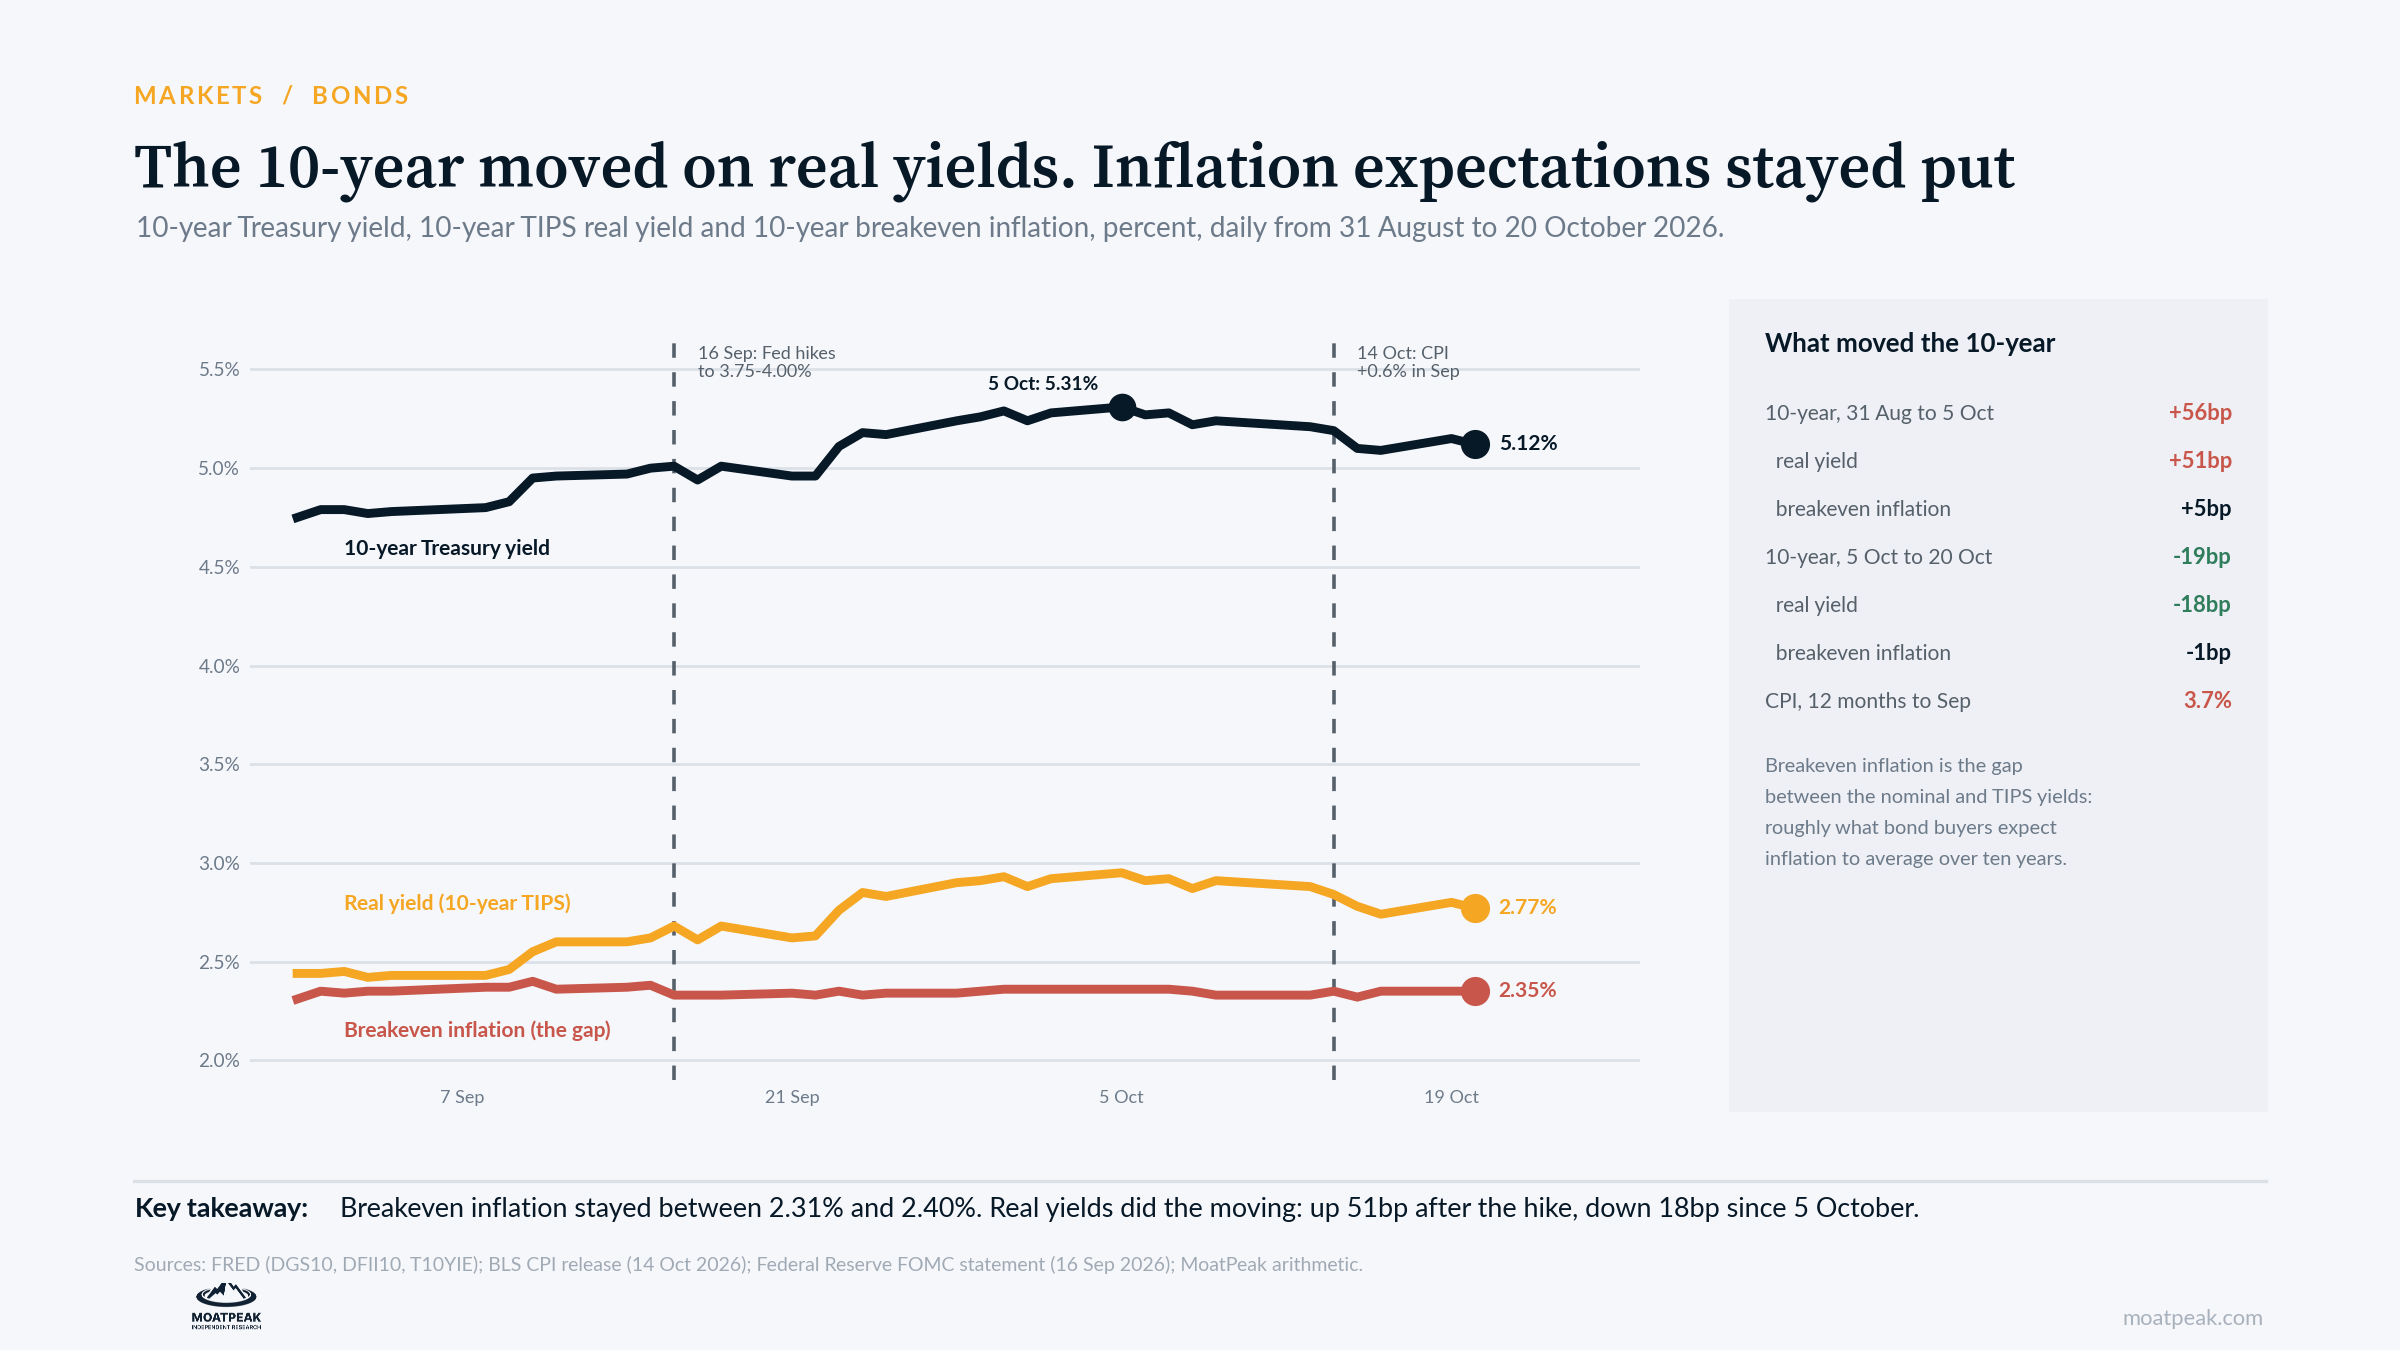
That pattern matters. If investors thought the Fed was losing control of inflation, breakevens would have risen. If they thought September was a one-off, breakevens would have fallen. They did neither. What changed was the real return investors demand to lend for ten years, and real yields usually fall when investors expect slower growth or want safety.
The front end hasn’t budged
The 2-year yield tracks what investors expect from the Fed over the next two years. On 16 September, the Fed raised its target range by a quarter point to 3.75 percent to 4.00 percent and said it “will deliver price stability.” On 20 October, the 2-year yield was 4.79 percent, about 80 basis points above the top of that range, which suggests the market still expects more hikes.
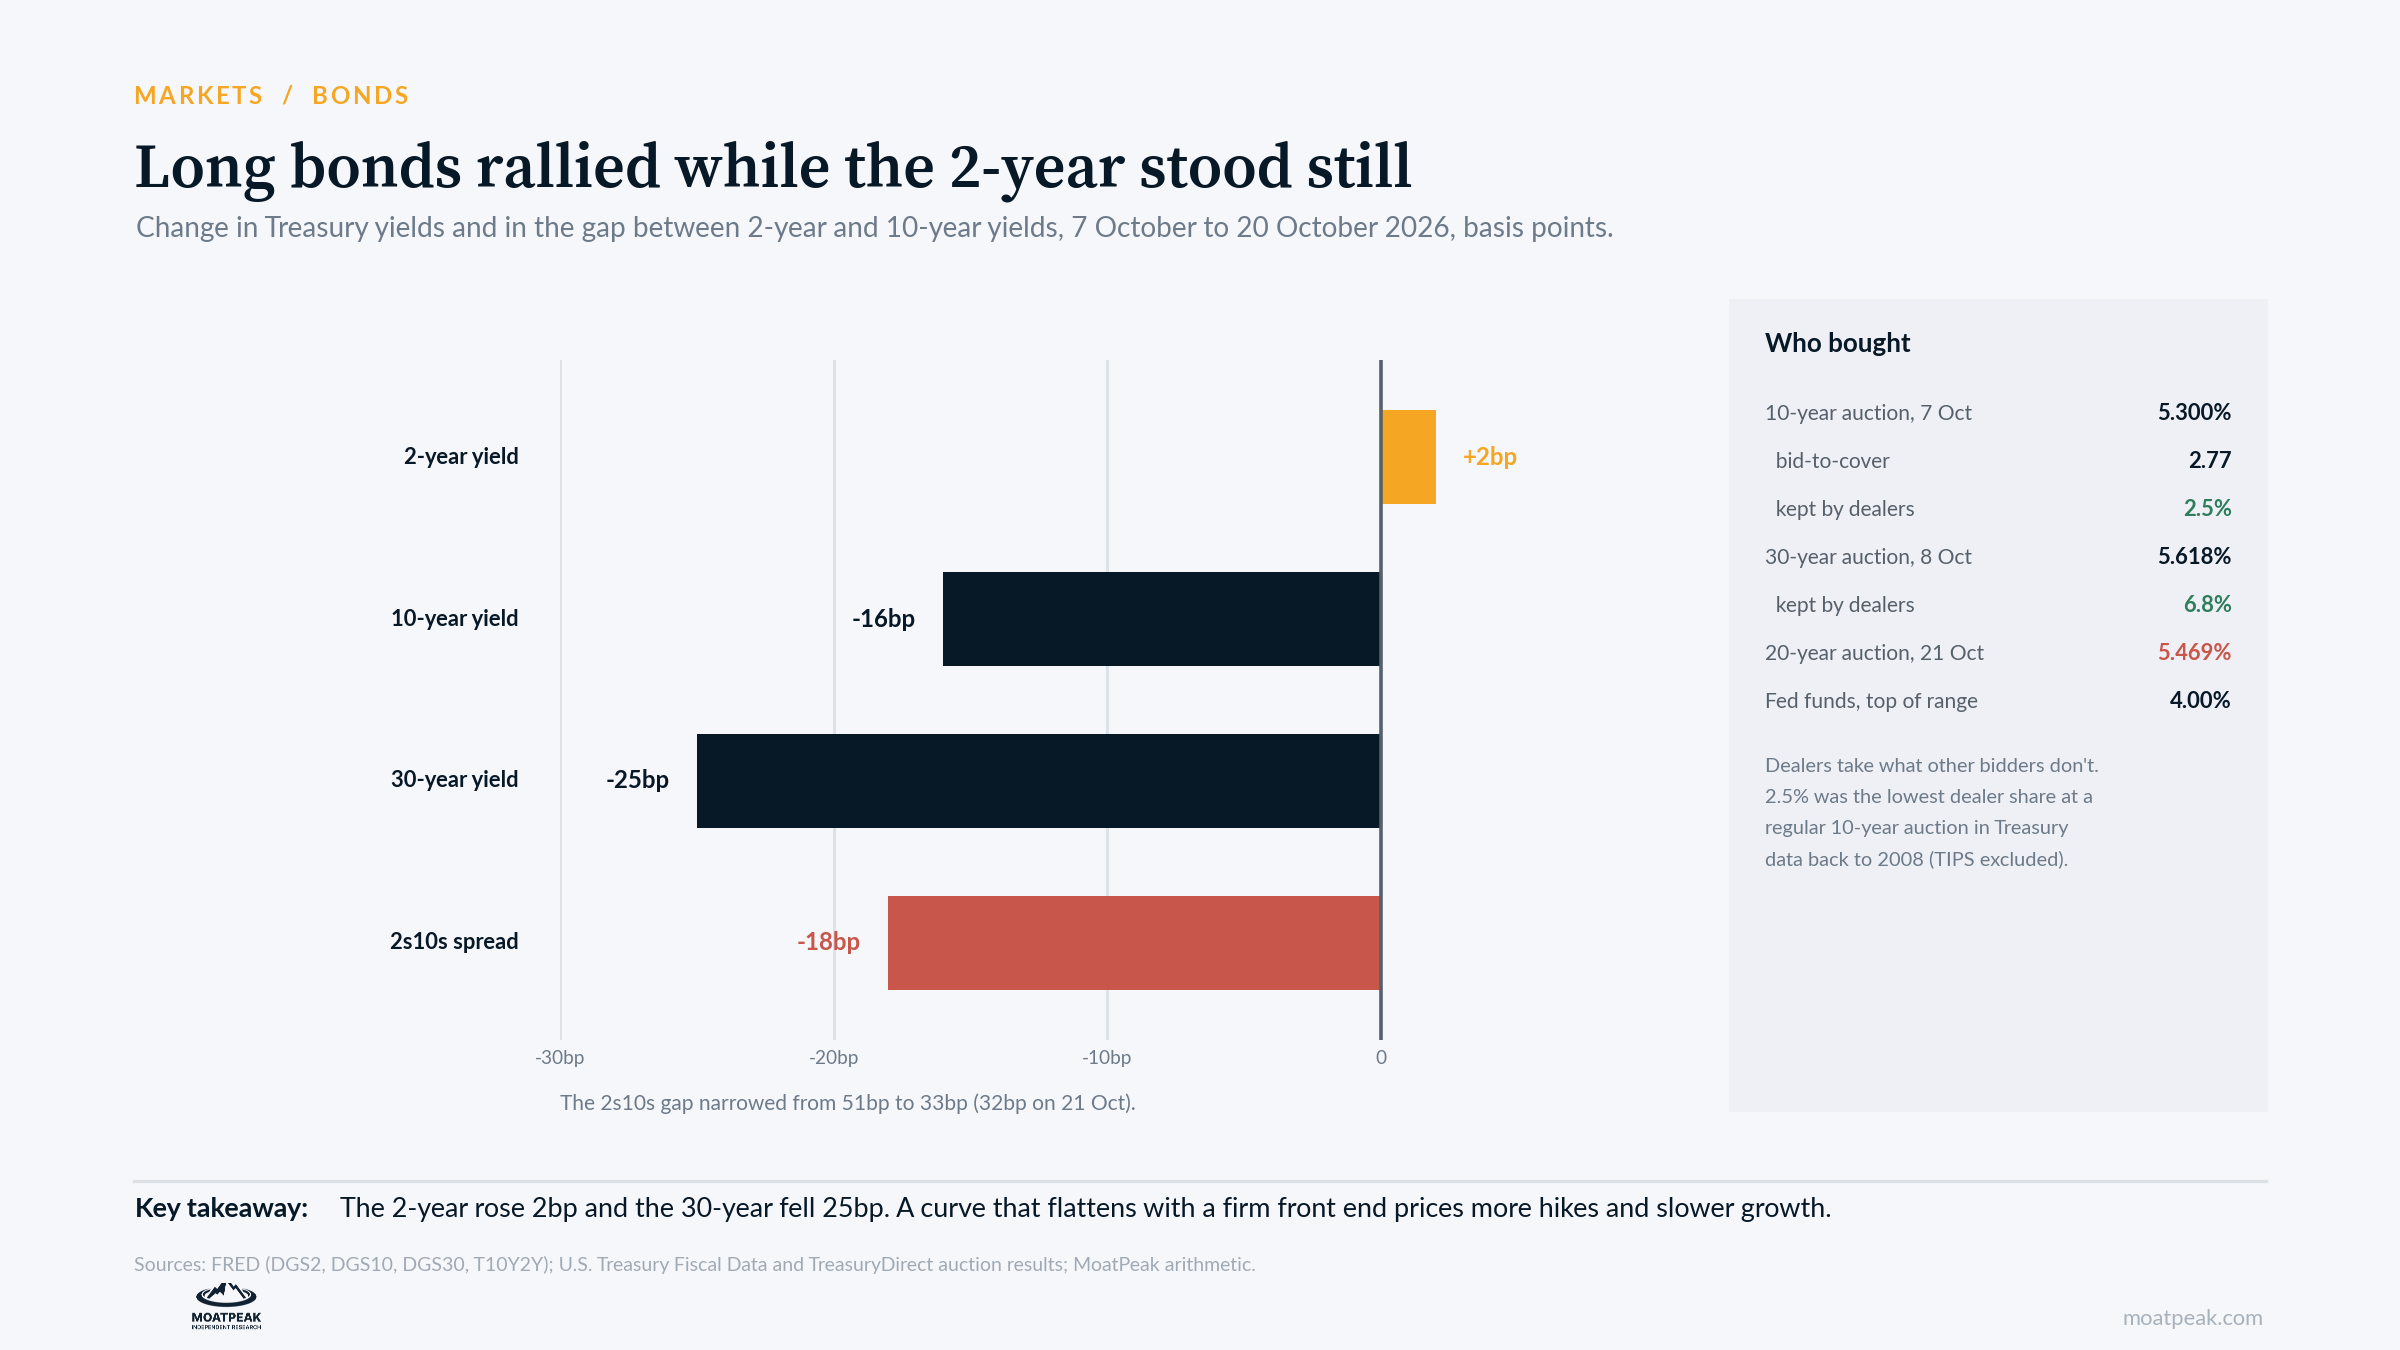
From 7 October to 20 October, the 2-year yield rose 2 basis points while the 30-year yield fell 25 basis points. The gap between the 2-year and 10-year yields narrowed from 51 basis points to 33. Traders call that a bull flattener. When it comes with a firm front end and a Fed that is still hiking, it usually means investors expect policy to slow the economy.
Real buyers showed up at 5.3 percent
The auctions support the same reading. At the 7 October sale of $39 billion of 10-year notes, priced at 5.300 percent, primary dealers kept just 2.5 percent. Dealers take whatever other bidders don’t, so a low dealer share means strong demand from end buyers. In Treasury’s data, which go back to 2008, no regular 10-year auction had a lower dealer share. Indirect bidders, including foreign central banks and fund managers, took 80.3 percent. The next day’s 30-year auction was also strong, with dealers keeping 6.8 percent.
The long end still has soft spots. On 21 October, the 20-year bond sold at 5.469 percent, the highest yield for that maturity since Treasury brought it back in 2020.
Our read: bonds trust the Fed and fear the cure
The popular take is that bond investors have decided the inflation spike will pass. The data say something more specific. Investors still trust the Fed to contain inflation, and breakevens show it. What they are pricing now is the cost of containing it: higher rates for longer, on top of an energy shock that already squeezes consumers. Diesel costs $6.28 a gallon, 73 percent more than a year ago.
That is how a policy mistake would first show up in the bond market: a Fed that keeps tightening into a slowdown. If that reading is right, growth data will now move long bonds more than inflation data does.
The case against us
Positioning may explain part of the move. Investors who bet on higher yields after the September hike had to buy bonds back when the auctions went well, and that buying can push yields down fast without any change in the outlook. Breakevens can also be distorted by thin trading in TIPS. And one month does not make a trend. The October CPI report on 10 November could restart the selling.
What it means for your money
Watch breakevens, not just yields. While 10-year breakeven inflation stays in its 2.31 to 2.40 percent range, long bonds can still serve as a hedge against a growth scare. A clear break higher would mean inflation fears are spreading, and that hedge would weaken.
Use the 2-year as the Fed’s scoreboard. If it starts falling while the Fed is still hiking, the market is betting the Fed will soon have to reverse course.
Ask why yields are falling. This time, lower long yields reflect weaker growth expectations at least as much as easier money, which is a less friendly signal for cyclical stocks.
What we are watching
Tuesday and Wednesday, 27 and 28 October: the Fed’s rate decision and what it says about the energy shock.
Early November: Treasury’s quarterly refunding announcement, including any change to auction sizes.
Tuesday 10 November: October CPI.
Every week: the EIA’s diesel stocks and retail prices, the fastest read on the energy shock.
Educational research only. Not personalized investment advice. MB “MoatPeak Group”.