


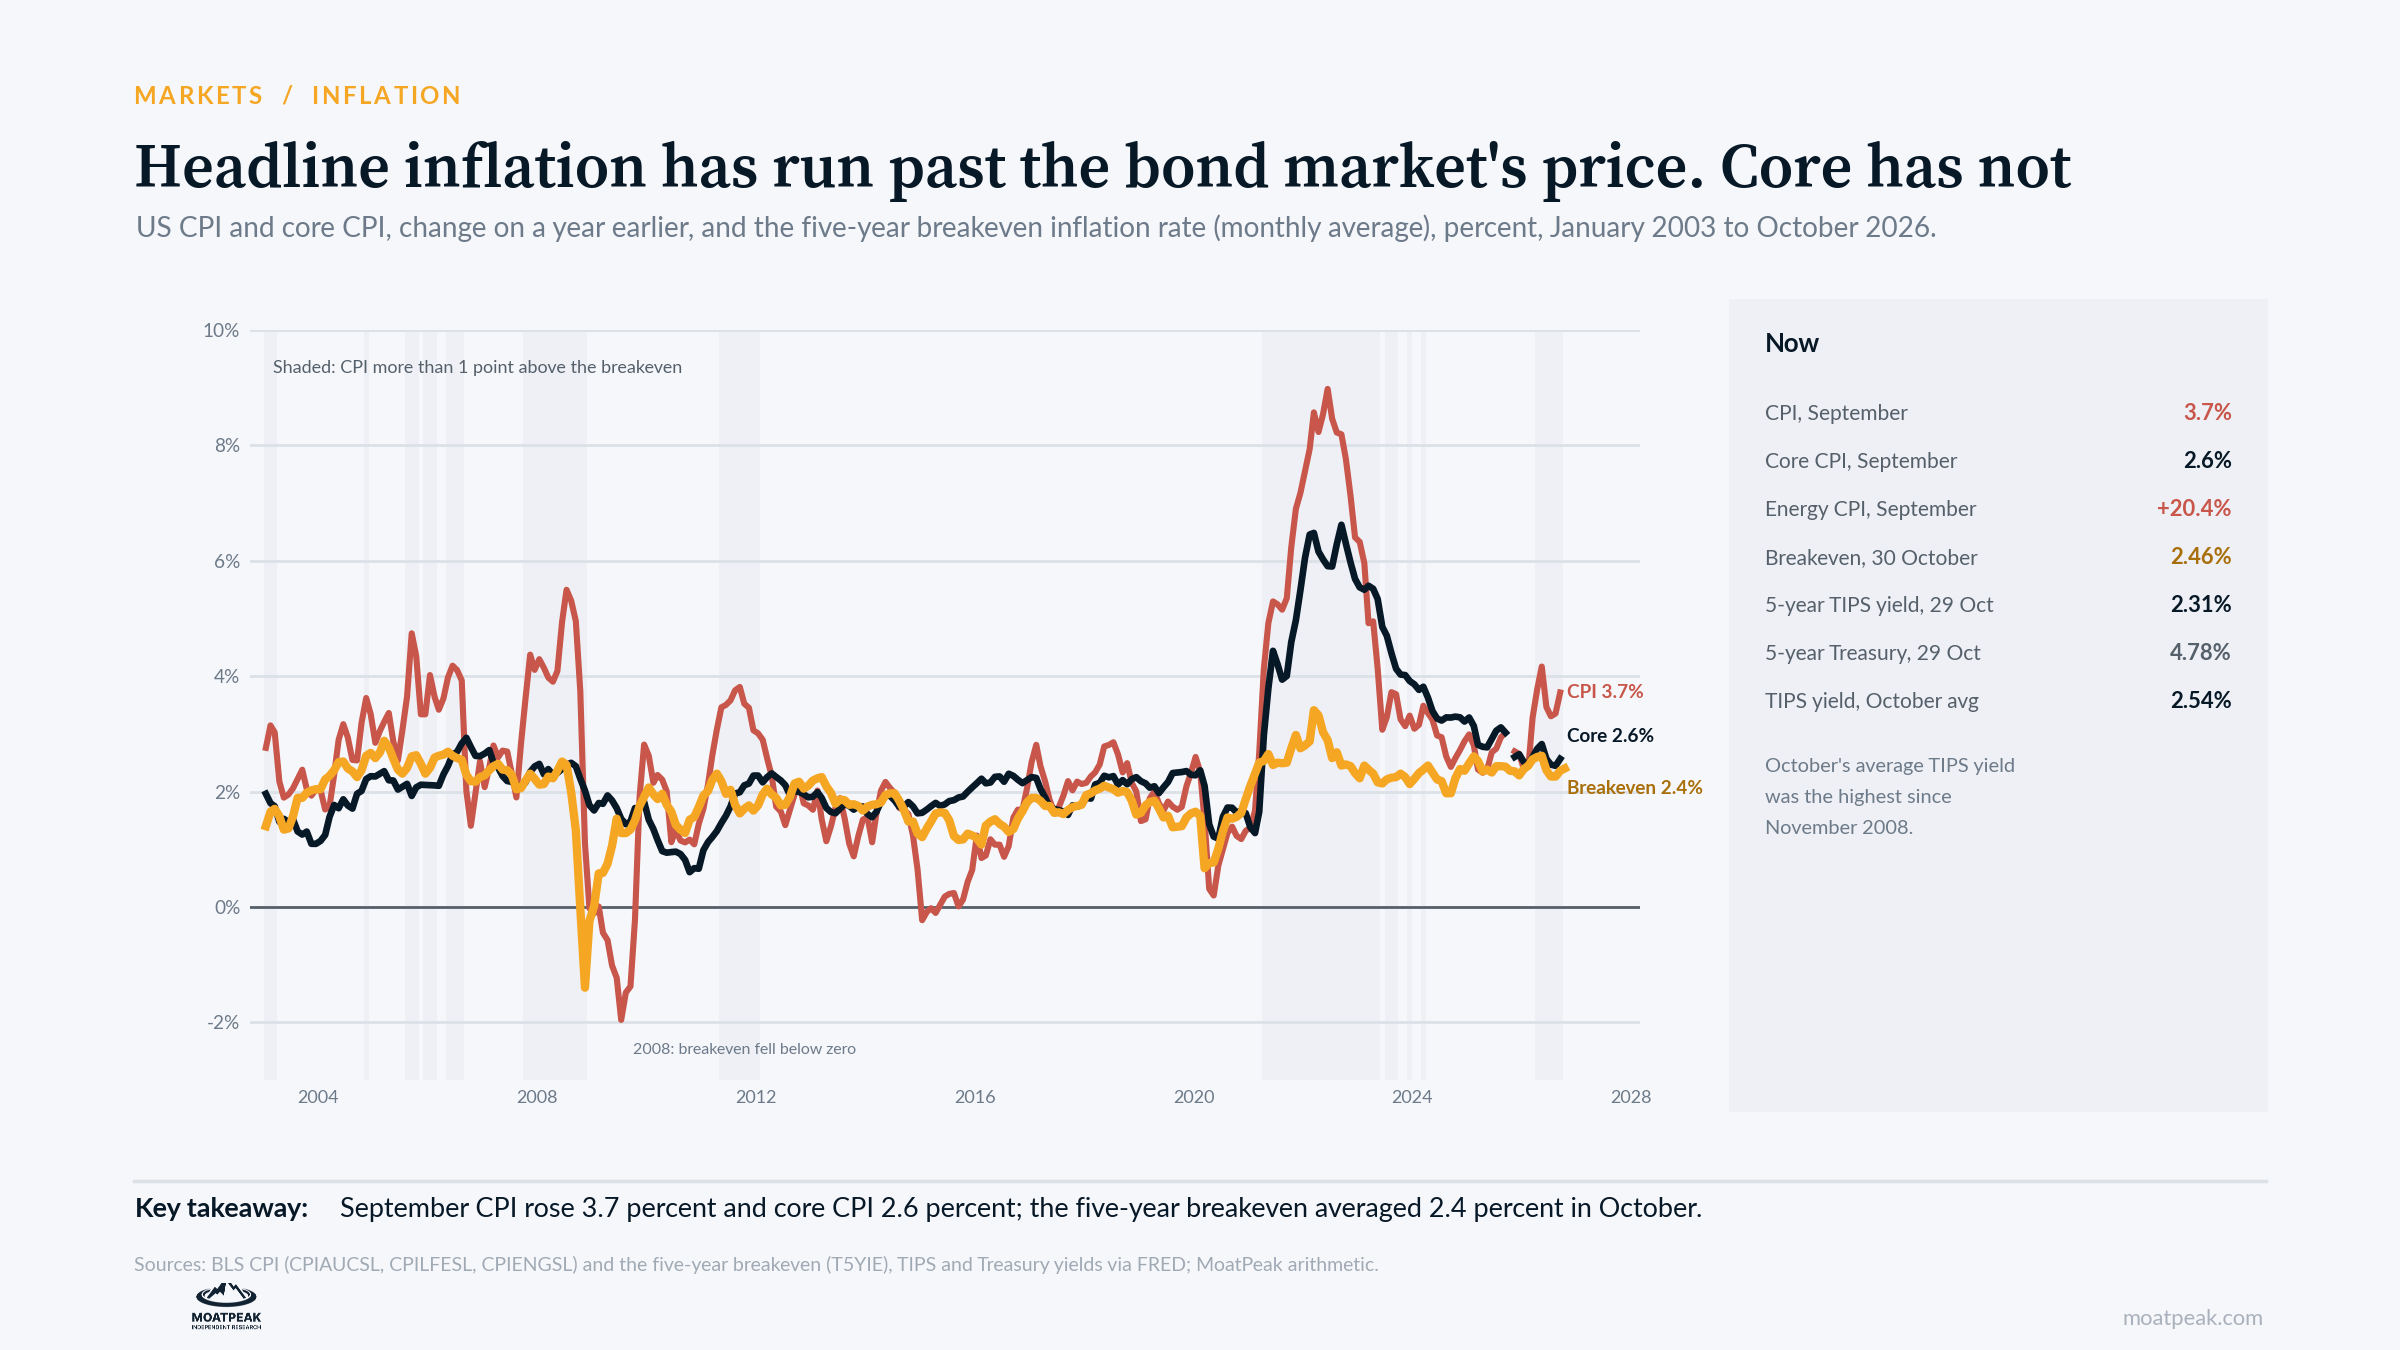
US consumer prices rose 3.7 percent in the year through September, lifted by a 20.4 percent jump in energy prices. Core prices, which exclude food and energy, rose 2.6 percent.
The bond market is pricing something much calmer. The five-year breakeven, the gap between the yields on regular and inflation-protected five-year Treasuries, closed October at 2.46 percent. That is the average inflation rate at which the two bonds pay the same over the next five years.
A gap that wide between current inflation and the market’s price looks like complacency, and it makes inflation-protected bonds look cheap. We tested that reading against the record.
What the record shows
We took every month from January 2003, when the daily breakeven series begins, to September 2021, the last start date with five full years of CPI data after it. For each month, we compared the breakeven at the start with the inflation that followed over the next five years. That gives 224 months.
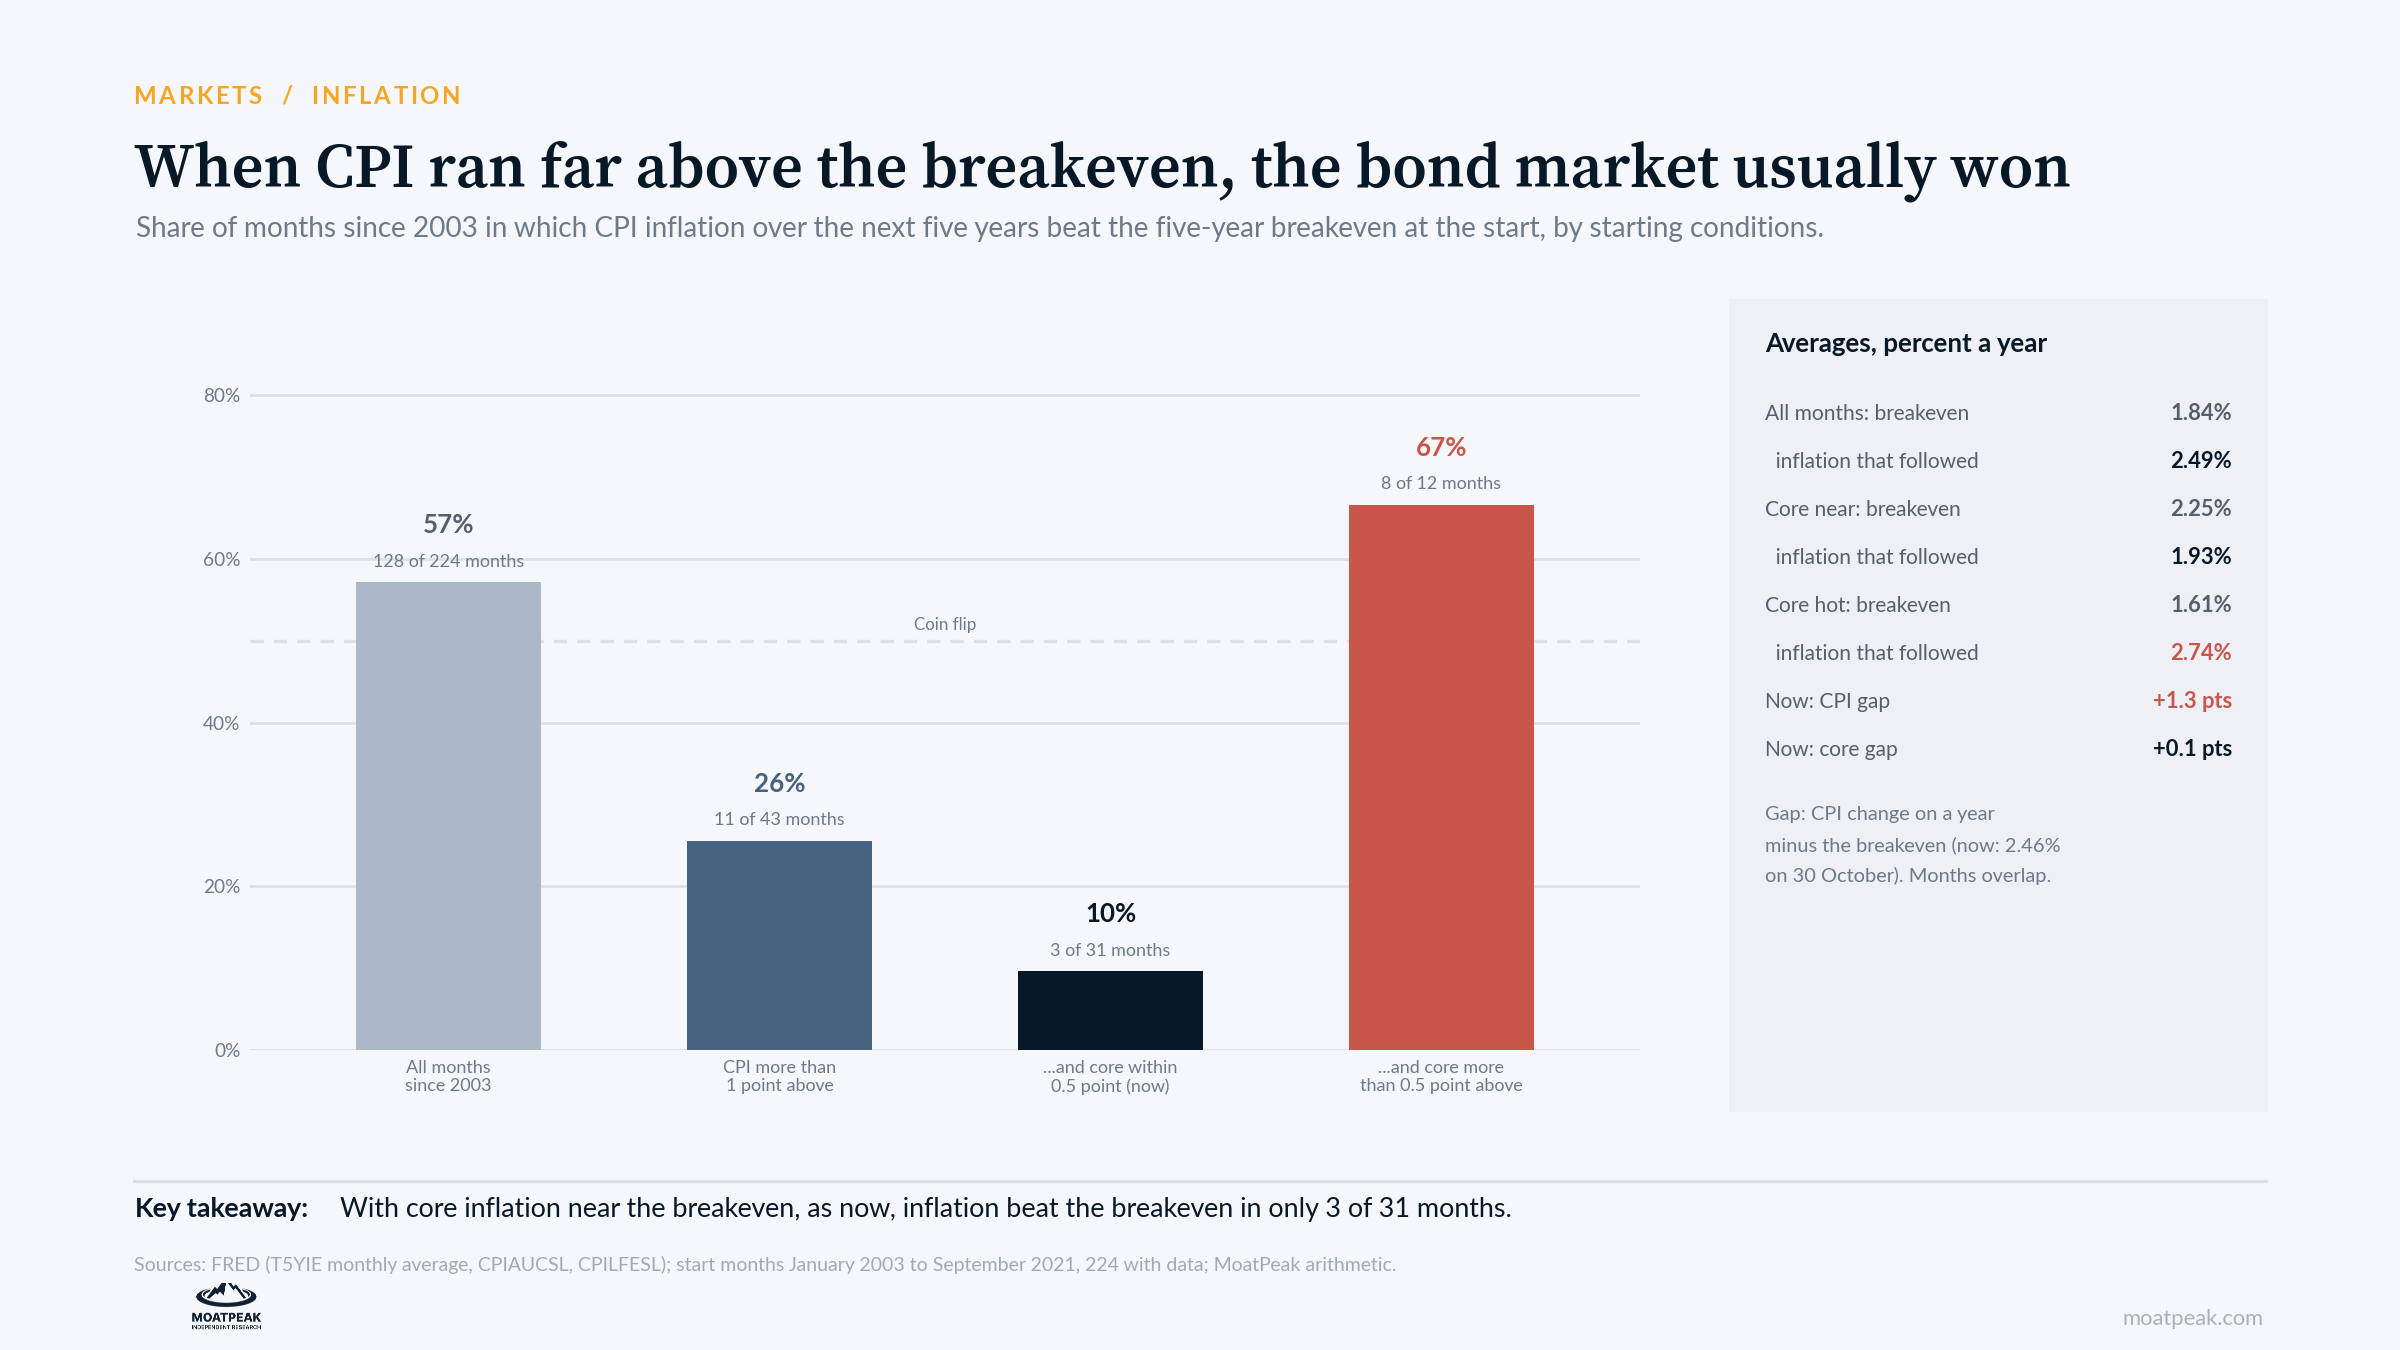
Across all of them, the market’s price was usually too low. Inflation beat the starting breakeven in 57 percent of months, and on average it ran 0.65 points a year above it.
The record flips when headline inflation runs far above the breakeven, as it does now. CPI inflation ran more than a point above the breakeven in 43 months. Inflation over the following five years beat the breakeven in only 11 of them, or 26 percent.
Core inflation decides
Core inflation separated the two outcomes. In 31 of those 43 months, core inflation was within half a point of the breakeven. Inflation beat the breakeven in just 3 of them. On average, the breakeven was 2.25 percent, and inflation came in at 1.93 percent. Twenty-seven of the 31 months fell during the energy price spikes of 2005 to 2008 and 2011, and both times energy prices later dropped.
In the other 12 months, core inflation ran more than half a point above the breakeven. Inflation beat the breakeven in 8 of them, averaging 2.74 percent against a 1.61 percent breakeven. That group mixes 2021, when core inflation climbed to about 4 percent, with late 2008, when the breakeven itself collapsed during the financial crisis.
On September’s CPI and the 30 October breakeven, headline inflation is 1.3 points above the breakeven and core is 0.1 points above it. That puts us firmly in the first group.
Our read
The headline gap is mostly an energy story, and the bond market has usually been right to look through energy when core inflation stayed calm. In that setting, the breakeven was more often too high than too low. On this record, 2.46 percent looks like a fair price for the next five years of inflation.
That changes the case for TIPS more than it ends it. The stronger argument for them is their own yield. Five-year TIPS yielded 2.54 percent on average in October, the highest monthly average since November 2008. On 29 October, they yielded 2.31 percent. Holding one to maturity locks in that return above inflation, whatever inflation turns out to be. The record gives little support for buying them as a bet that inflation will beat the market’s price.
The case against us
The sample is small. The 43 months overlap and come from a handful of episodes, so one new episode could change the odds.
The errors are lopsided. When core sat near the breakeven, the breakeven overshot by about 0.3 points a year on average. Its worst miss went the other way: in April 2021 it priced 2.53 percent. Core inflation began to surge the next month, and inflation averaged 4.51 percent over the following five years.
Oil may not fall this time. The expiring December Brent contract settled at $117.64 a barrel on 30 October. If energy prices stay high long enough, they leak into core prices through transport, goods and services. That is how 2021 turned.
The full record also favors TIPS buyers. Over all 224 months, inflation beat the breakeven by 0.65 points a year on average, partly because TIPS are less liquid than regular Treasuries, which tends to hold the breakeven down.
What it means for your money
Be cautious about buying inflation protection just because headline inflation is high. On this record, a wide headline gap was a weak signal on its own.
Watch core. The odds changed when core inflation ran more than half a point above the breakeven. At the 30 October breakeven, that would mean core CPI near 3 percent, against 2.6 percent in September.
Judge TIPS on their real yield. A return of more than 2 percent a year above inflation for five years is the strongest part of the case, and it holds either way inflation goes.
What we are watching
10 November: October CPI. A core reading that moves toward 3 percent would put us in the group where inflation has usually beaten the breakeven.
8 and 9 December: the Fed’s last meeting of the year, and how it weighs 3.7 percent headline inflation against 2.6 percent core.
The Brent curve: if prices for 2028 delivery climb toward current prices, the market is starting to treat high oil prices as lasting.
Educational research only. Not personalized investment advice. MB “MoatPeak Group”.