


A one-day drop of 4 percent in the S&P 500 usually signals a market already in trouble. The 4.4 percent drop on 5 November came a day after the index closed just 1.7 percent below its record. That difference matters for what tends to come next, so we went through every drop of that size since 1950.
Where big drops usually happen
Before 5 November, the index had fallen 4 percent or more in a single session 56 times since January 1950. At the median, it was already 23 percent below its record when the drop began. In 46 of the 56 cases, it was more than 10 percent below, and most of those drops clustered in the crashes of 1987, 2008 and 2020.
Even October 1987 fits the pattern. When the S&P 500 lost 20.5 percent on 19 October 1987, it was already 16 percent below its August record.
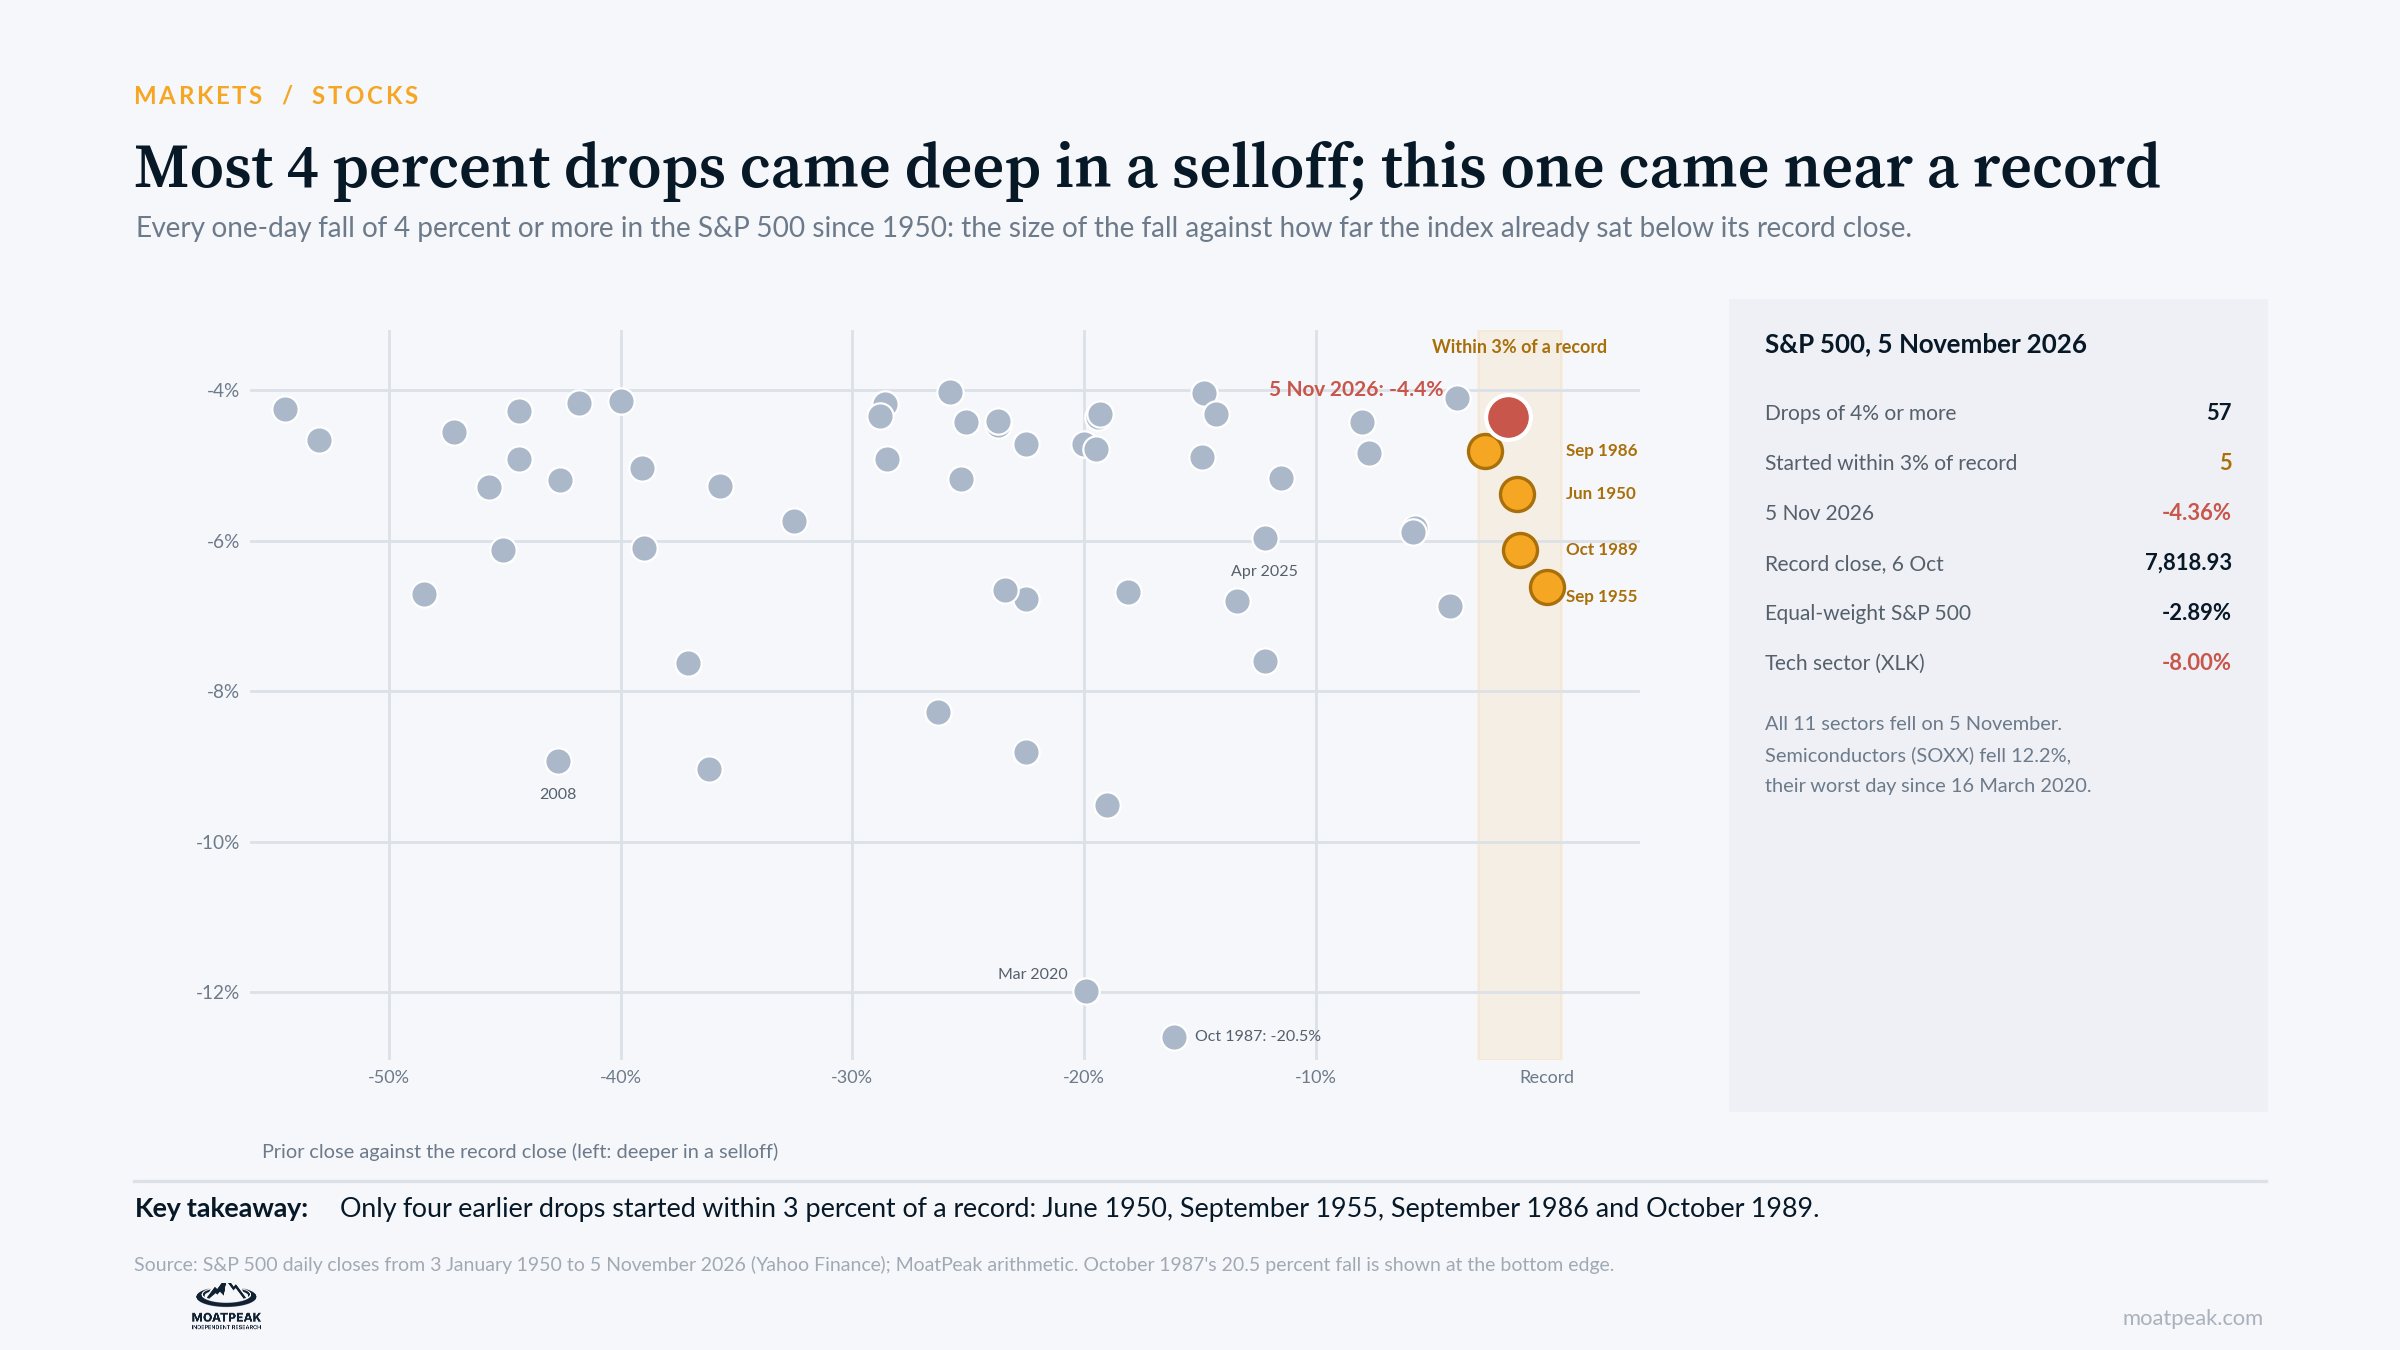
The four that started near a record
Only four earlier drops began within 3 percent of a record: 26 June 1950, the first session after North Korea invaded the South; 26 September 1955, after President Eisenhower’s heart attack; 11 September 1986; and 13 October 1989, when financing for a buyout of United Airlines’ parent company fell apart.
All four were higher three months later, by a median of 6.4 percent. The ride was bumpy. Three of the four were lower a week later, and after a month the median gain was 0.1 percent. Widen the band to 5 percent below a record, and two more cases join: October 1997 and February 2018. All six were higher three months later.
For scale, a 6.4 percent gain from the 5 November close of 7,353.73 would take the index to about 7,824, just above its 6 October record of 7,818.93.
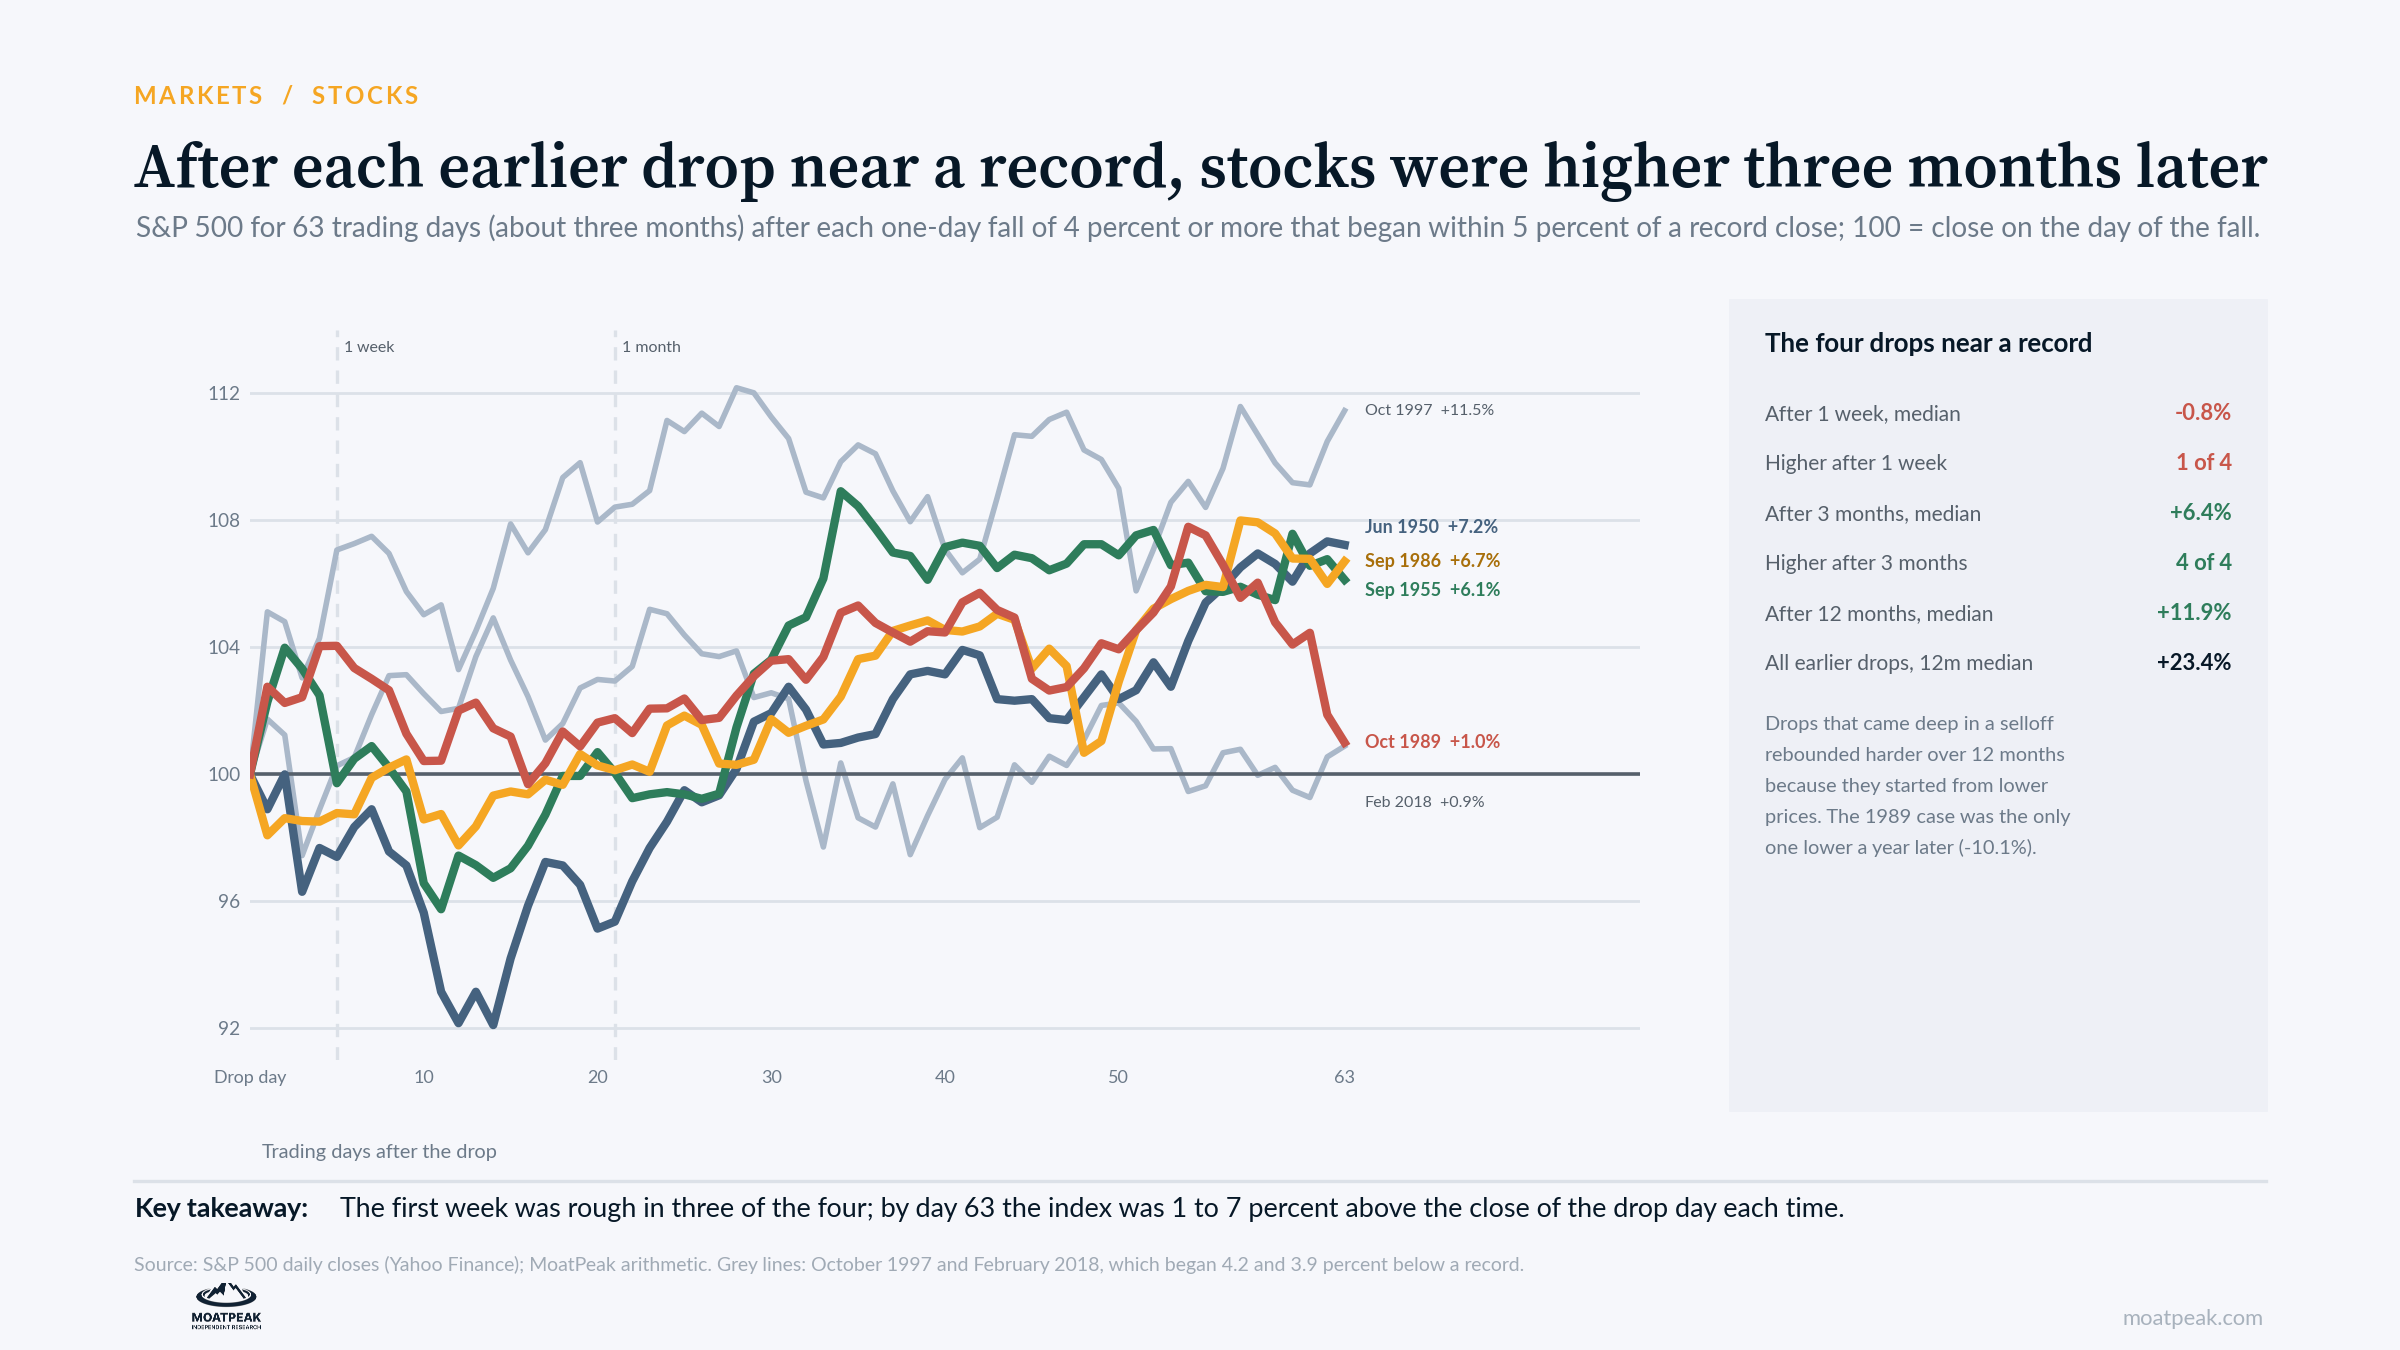
The catch: a smaller rebound
Drops deep in a selloff tend to be followed by large gains because prices are already depressed. A year after the 46 deep drops, the index was up a median 24.8 percent. A year after the four drops near a record, the median gain was 11.9 percent, and the year after October 1989 brought a 10.1 percent loss.
History favors holding through a drop like this one, but it offers little support for buying it in the hope of a crash-sized rebound. A market that falls from near a record has little discount to recover.
What made 5 November different
The damage was narrow. The equal-weight S&P 500, which gives every company the same weight, fell 2.9 percent against 4.4 percent for the index. The technology sector lost 8.0 percent, its worst day since March 2020. A semiconductor ETF tracking the chip sector fell 12.2 percent, its second-worst day since it launched in 2001. Nvidia alone shed about $447 billion of market value.
All 11 sectors fell, but the smallest losses came in communication services, utilities and consumer staples, each under 1 percent. The VIX, a gauge of expected volatility, jumped from 16.6 to 28.2.
Our read
We read 5 November as a shock to a crowded trade inside a market that was healthy the day before. The base rate favors patience: in every comparable case, the index won back the day’s loss at some point within three months. It also argues for modest expectations. Cases like this one recovered in months, then delivered ordinary gains.
The case against us
Four cases make a small sample, and none of them came with the index this concentrated in a single theme.
The closest thematic match sits just outside our band. On 14 April 2000, as the dot-com boom unwound, the S&P 500 fell 5.8 percent from 5.7 percent below its record. Three months later it was up 11.3 percent. A year later it was down 12.1 percent.
Policy also offers less cushion than usual. The Bank of England raised rates on 5 November to guard against oil-driven inflation.
What it means for your money
Don’t treat one day as a new bear market. In the four closest cases, the index was higher three months later.
Expect a rough first month. Three of those four were lower a week later.
Keep rebound hopes modest. Gains over the following year were about half those after drops deep in a selloff.
Know what you own. The index fell further than the average stock because a handful of chip and AI names dominate it.
What we are watching
17 November: Nvidia’s third-quarter results, the first hard data on whether the chip selloff reflects weaker demand.
Breadth: whether the equal-weight index keeps holding up better than the cap-weighted one.
7,818.93: the 6 October record, 6.3 percent above the 5 November close.
Educational research only. Not personalized investment advice. MB “MoatPeak Group”.
Your split between drops near a record and drops deep in a selloff is the part I will keep. A 4.4 percent fall feels like a crash day, but when the index was only 1.7 percent below its record the day before, there was no discount to recover, so a modest rebound is the honest expectation. What struck me most is how narrow the damage was. The equal weight index fell 2.9 percent while the cap weighted index fell 4.4, and the chip ETF fell 12.2 percent. That tells me this was a crowded trade unwinding, not a market giving up on the economy. I am holding through it, as the base rate suggests, but I am not expecting the kind of rebound that follows a real selloff. My watchlist is the same as yours: Nvidia on 17 November, and whether breadth keeps holding up better than the headline index.