


The number comes from a bank’s trading desk, so most people are repeating it based on trust.
We decided to recreate the calculation using free data. You can check every step yourself in a spreadsheet.
The period covers three months, from 12 May to 11 August, looking at total returns and the annualized volatility of daily changes.
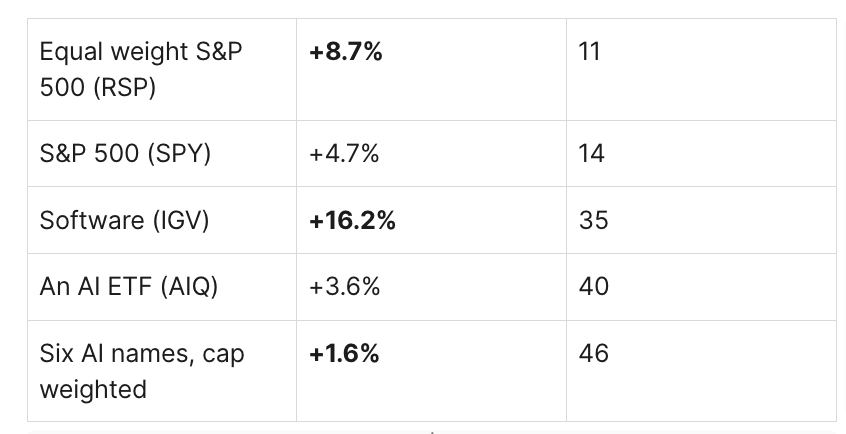
The six are Nvidia, Broadcom, AMD, Micron, Vertiv and Oracle.
If you compare the top and bottom rows, you’ll see the average American stock returned 8.7% with a volatility of 11. Meanwhile, the six companies at the heart of the biggest investment story in years returned just 1.6%, with volatility 46 times the risk – less than a fifth of the return.
This shows why volatility is a real cost, not just a statistic.
Many people see volatility as just an academic measure or something you find in a risk report. But it’s more than that. Volatility is often why people end up selling at the worst possible time.
A holding that moves 46% a year, annualized, will, at some point in a three-month window, be down enough to make you question the entire thesis at exactly the moment the news is worst. Most people do not hold through that. The ones who do pay for it in attention, sleep, and the other decisions they make badly while taking on that kind of stress and only getting a 1.6% return is a clear example of not being rewarded for the risk you take.
Here’s what surprised us the most.
Software stocks returned 16.2%, outperforming all other sectors. This is the sector many said would be hurt by AI over the summer. In reality, the market leaders last quarter were in the middle of the index and in the sector people thought would lose out, not in the headline stories.
Now, the honest caveats: this result is sensitive to how you build it.
If you change the group of stocks, the results change too. For example, giving each of our six AI stocks equal weight instead of weighting by market cap changes the return from +1.6% to −2.8%. Removing Oracle changes the outcome again. The AI ETF shows a return of +3.6%. So, the exact number depends on the choices we made, and we’ve shared the tickers and time frame so you can try your own version.
But no matter how we set it up, the volatility is always three to four times higher, and the return is always lower. That stays the same, however you look at it.
Three months is a short period, and if you looked at the same comparison over two years, the results would be very different, since these companies have had huge returns to reach this point. No one should think that AI’s story is over based on just one quarter. That’s not the point here.
So, what are we actually saying?
The extra reward you are supposed to earn for taking extra risk has gone missing in this specific part of the market. Right now, it is a pricing statement rather than a forecast.
A similar thing is happening in the credit market, which we’ll cover next: the extra yield you get for lending to an average company instead of an excellent one is now at its lowest point ever.
When two different markets stop rewarding risk at the same time, that’s something we should pay more attention to than if it happened in just one.
So, what should we take from this? Not simply ‘sell AI.’ Instead, focus on something more practical: look at what you actually earned for the risk you took this quarter, not just what you were promised for future risks.
Our full work is at moatpeak.com.
Educational research only. Not personalized investment advice. MB “MoatPeak Group”.