


Nvidia reported $96.22 billion in revenue for the quarter ending July 26, up 106% from last year and 18% from the previous quarter. Operating margin reached 66.2%. The company expects $108 billion in revenue next quarter and raised next year’s growth outlook from about 44% to 70%.
That last number is why the shares went from minus three per cent to plus five during the call. It is a genuine upgrade to how long this can run, and it should be said plainly before anything else.
But there are three important points from Nvidia’s own disclosures that most people are overlooking.
First, a $5 billion reclassification changes the growth story.
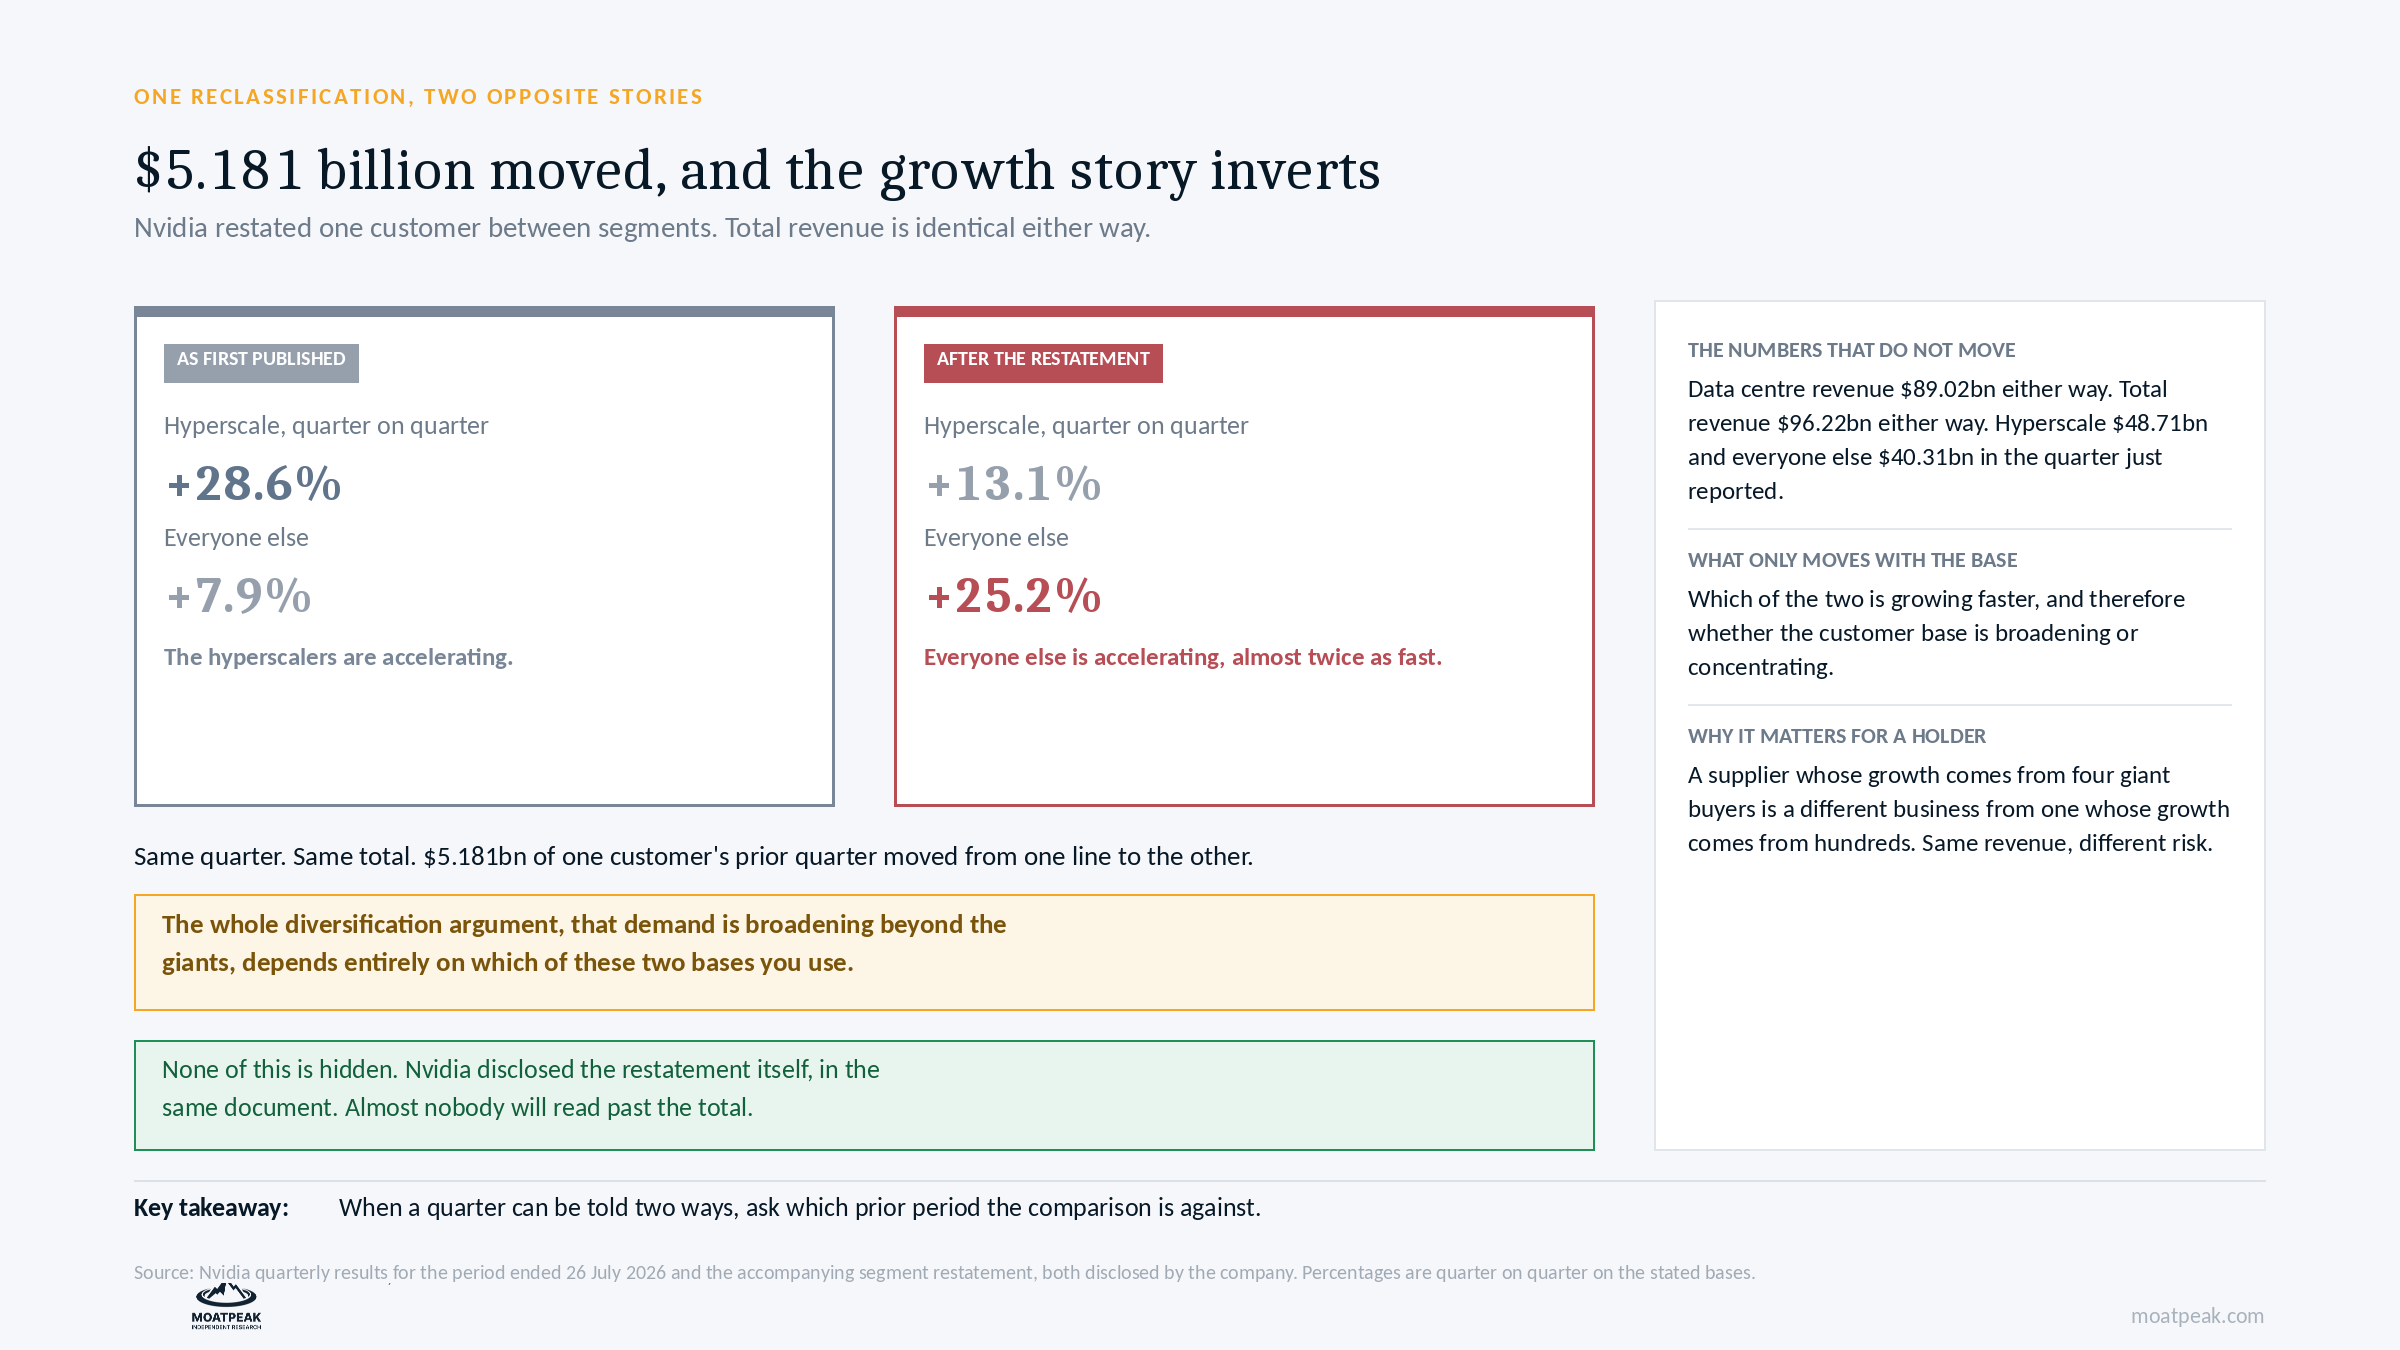
Nvidia revised last quarter’s results, shifting $5.181 billion in revenue from one customer out of its smaller data center segment and into the hyperscale category.
Total data center revenue stays at $89.02 billion, and total revenue remains $96.22 billion. The overall size of the business doesn’t change.
What does change is the answer to a key question: is demand spreading beyond the four big cloud customers?
With the restated numbers, hyperscale grew 13.1% this quarter, while everything else grew 25.2%. Demand is spreading out quickly.
If you use the original numbers, hyperscale grew 28.6% and everything else just 7.9%. That would mean demand is still concentrated.
The whole case for diversification depends on which comparison you look at. Nvidia included the restatement in the same report, but it’s easy to miss since the totals don’t change.
This affects your investment more than the company’s earnings. A business that relies on four customers is very different, in terms of pricing power and risk, from one that sells to hundreds. The revenue may look the same, but the risk is not.
Second, Nvidia discloses every part of its structure, but not how they all connect.
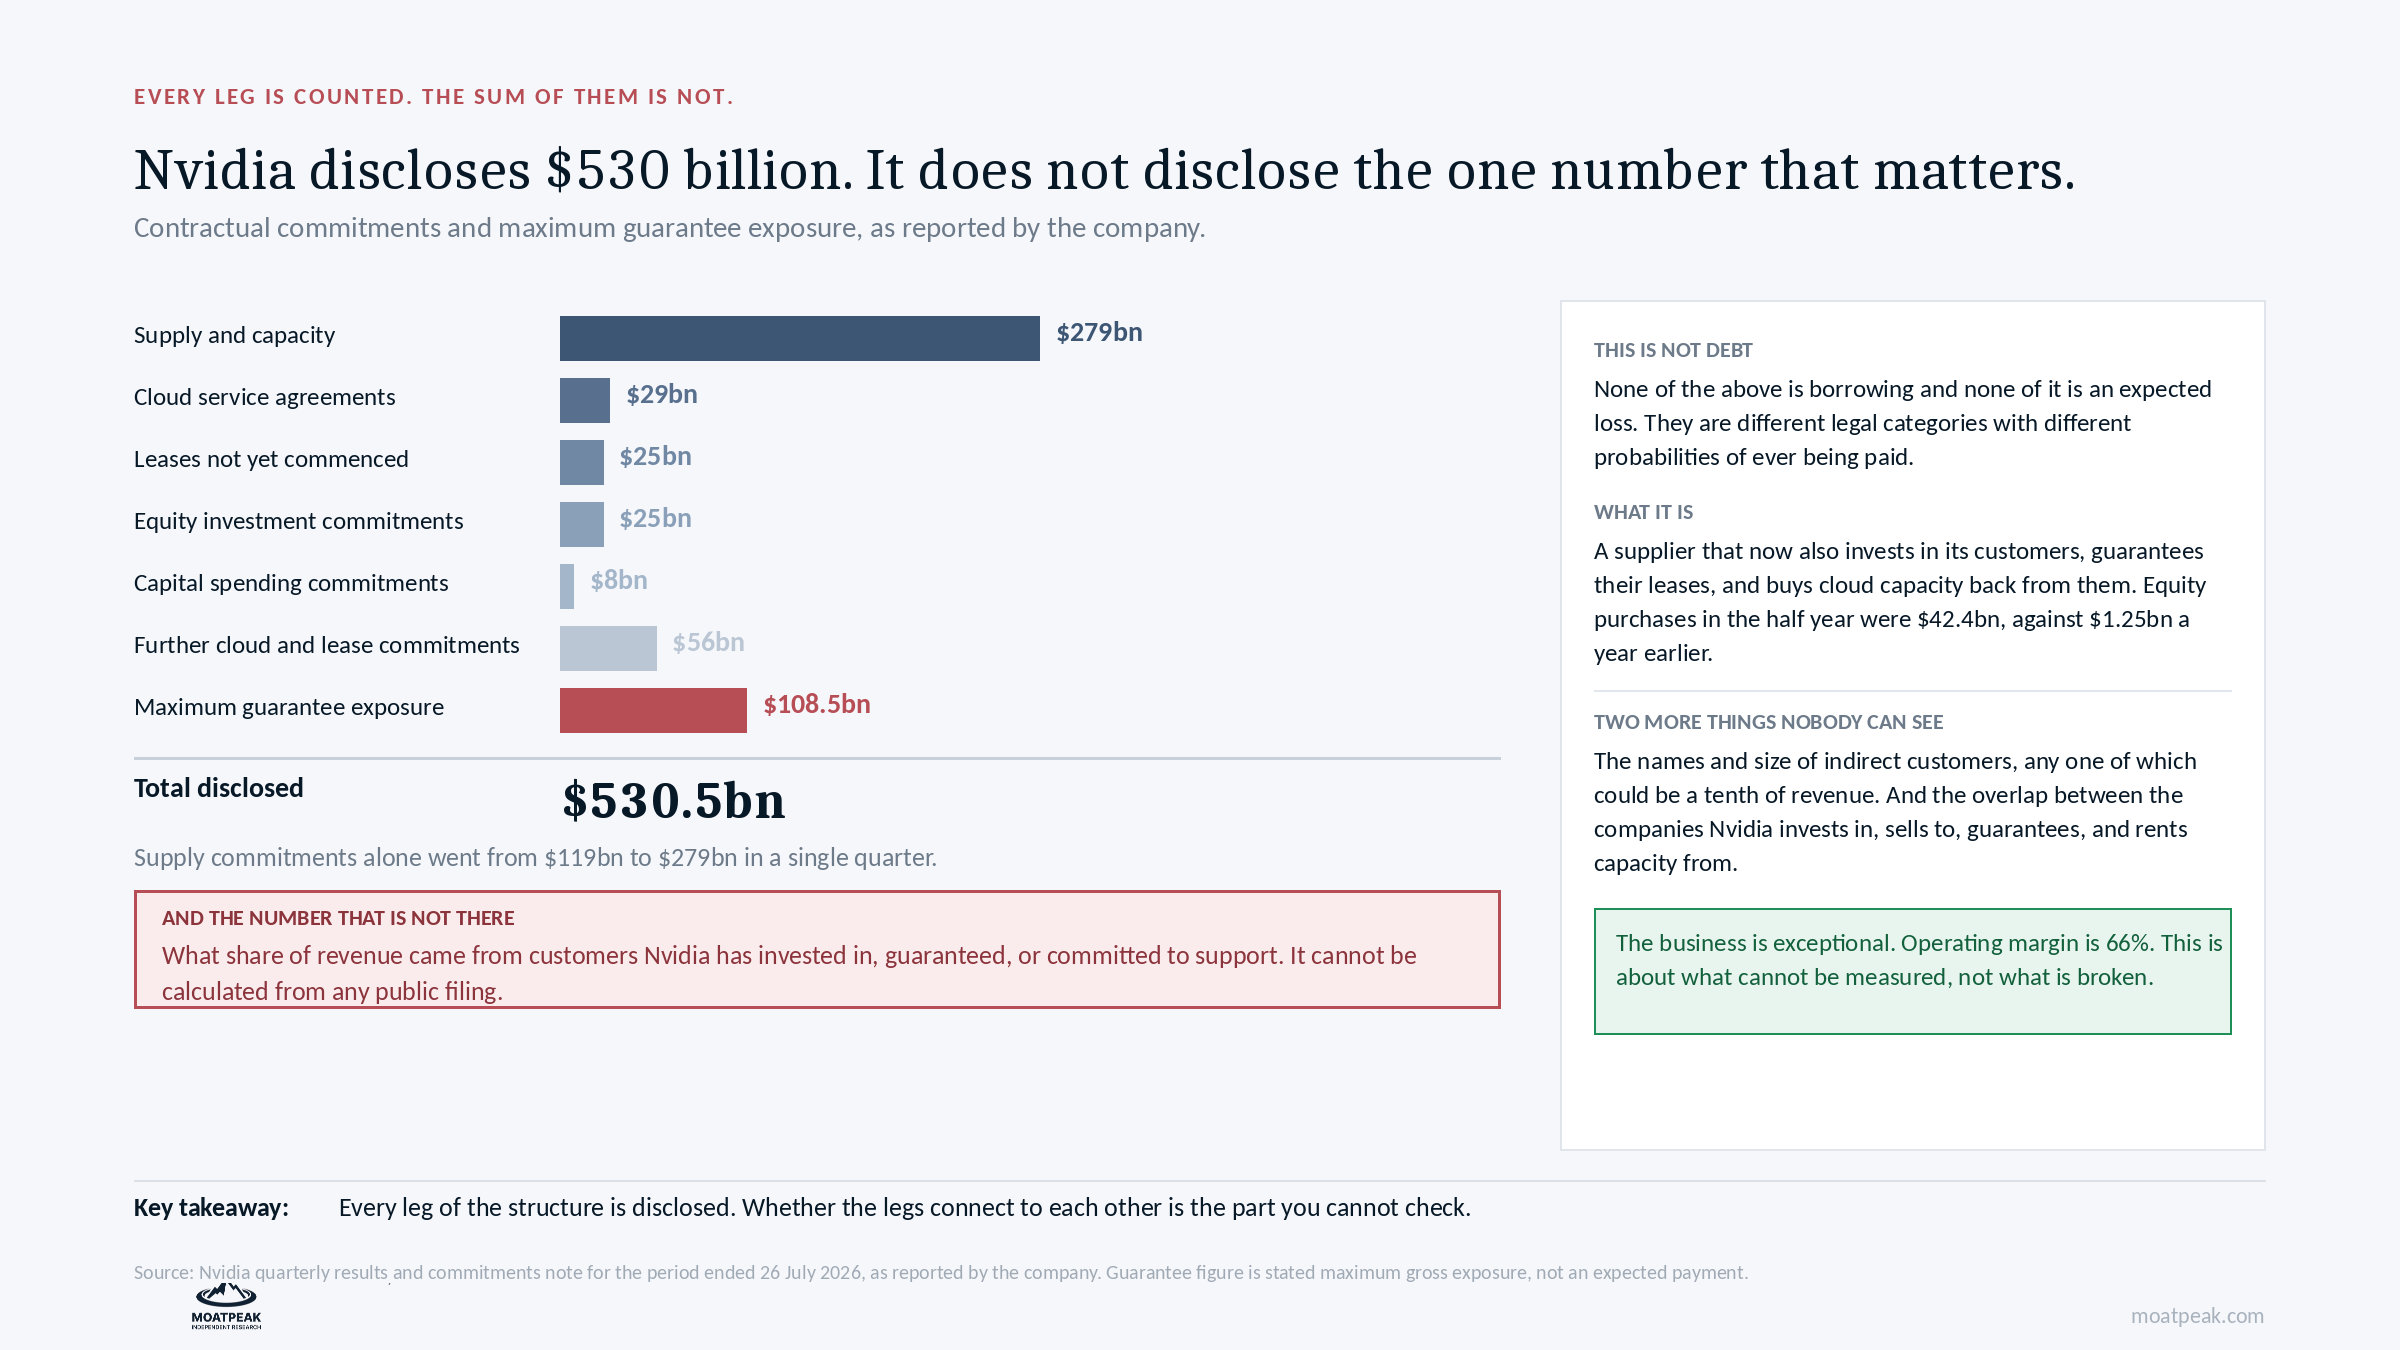
Nvidia is no longer just a supplier. Now, it invests in its customers, guarantees their leases, and even buys cloud capacity back from them.
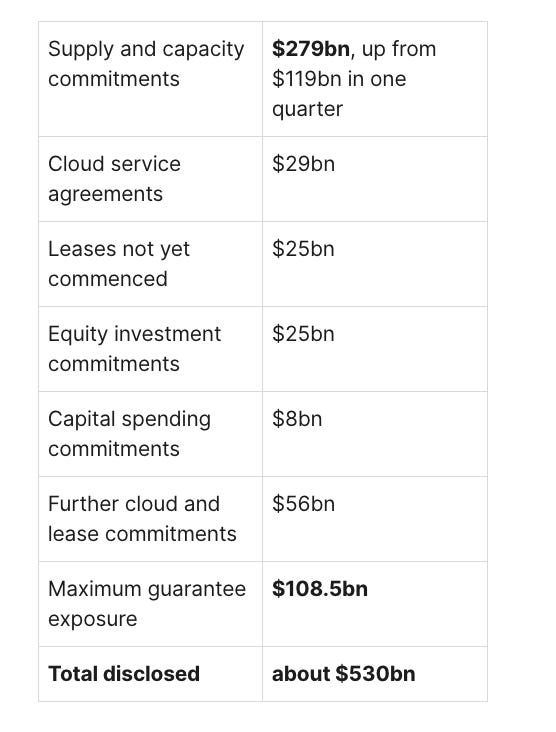
Here are the figures Nvidia has shared:
Supply and capacity commitments
$279bn, up from $119bn in one quarter
Cloud service agreements$29bnLeases not yet commenced$25bnEquity investment commitments$25bnCapital spending commitments$8bnFurther cloud and lease commitments$56bnMaximum guarantee exposure
$108.5bn
Total disclosed
about $530bn
Nvidia now holds $99 billion in equity stakes in other companies, and it bought $42.4 billion in shares during the first half of the year, compared to just $1.25 billion in the same period last year.
None of this counts as debt or as an expected loss. These are separate legal categories, each with different chances of being paid back. Treating them all as liabilities would be a mistake we often see and try to correct.
But there’s something you won’t find in any public filing: what portion of Nvidia’s revenue comes from customers it has invested in, guaranteed, or agreed to support?
That’s the most important number for judging the quality of this revenue, but it isn’t disclosed. We also don’t know how much overlap there is between the companies Nvidia invests in, sells to, guarantees, or rents capacity from. The names and size of indirect customers are also missing, and any one of them could make up a tenth of revenue through another company’s cloud.
We’re not making any accusations. Helping customers finance infrastructure can be a smart way to bring in outside capital, but it can also mean funding your own demand. Both can happen at the same time, and with the current disclosures, it’s impossible for outsiders to know how much of each is happening.
Third, margins didn’t actually rise and the expected cash didn’t show up.
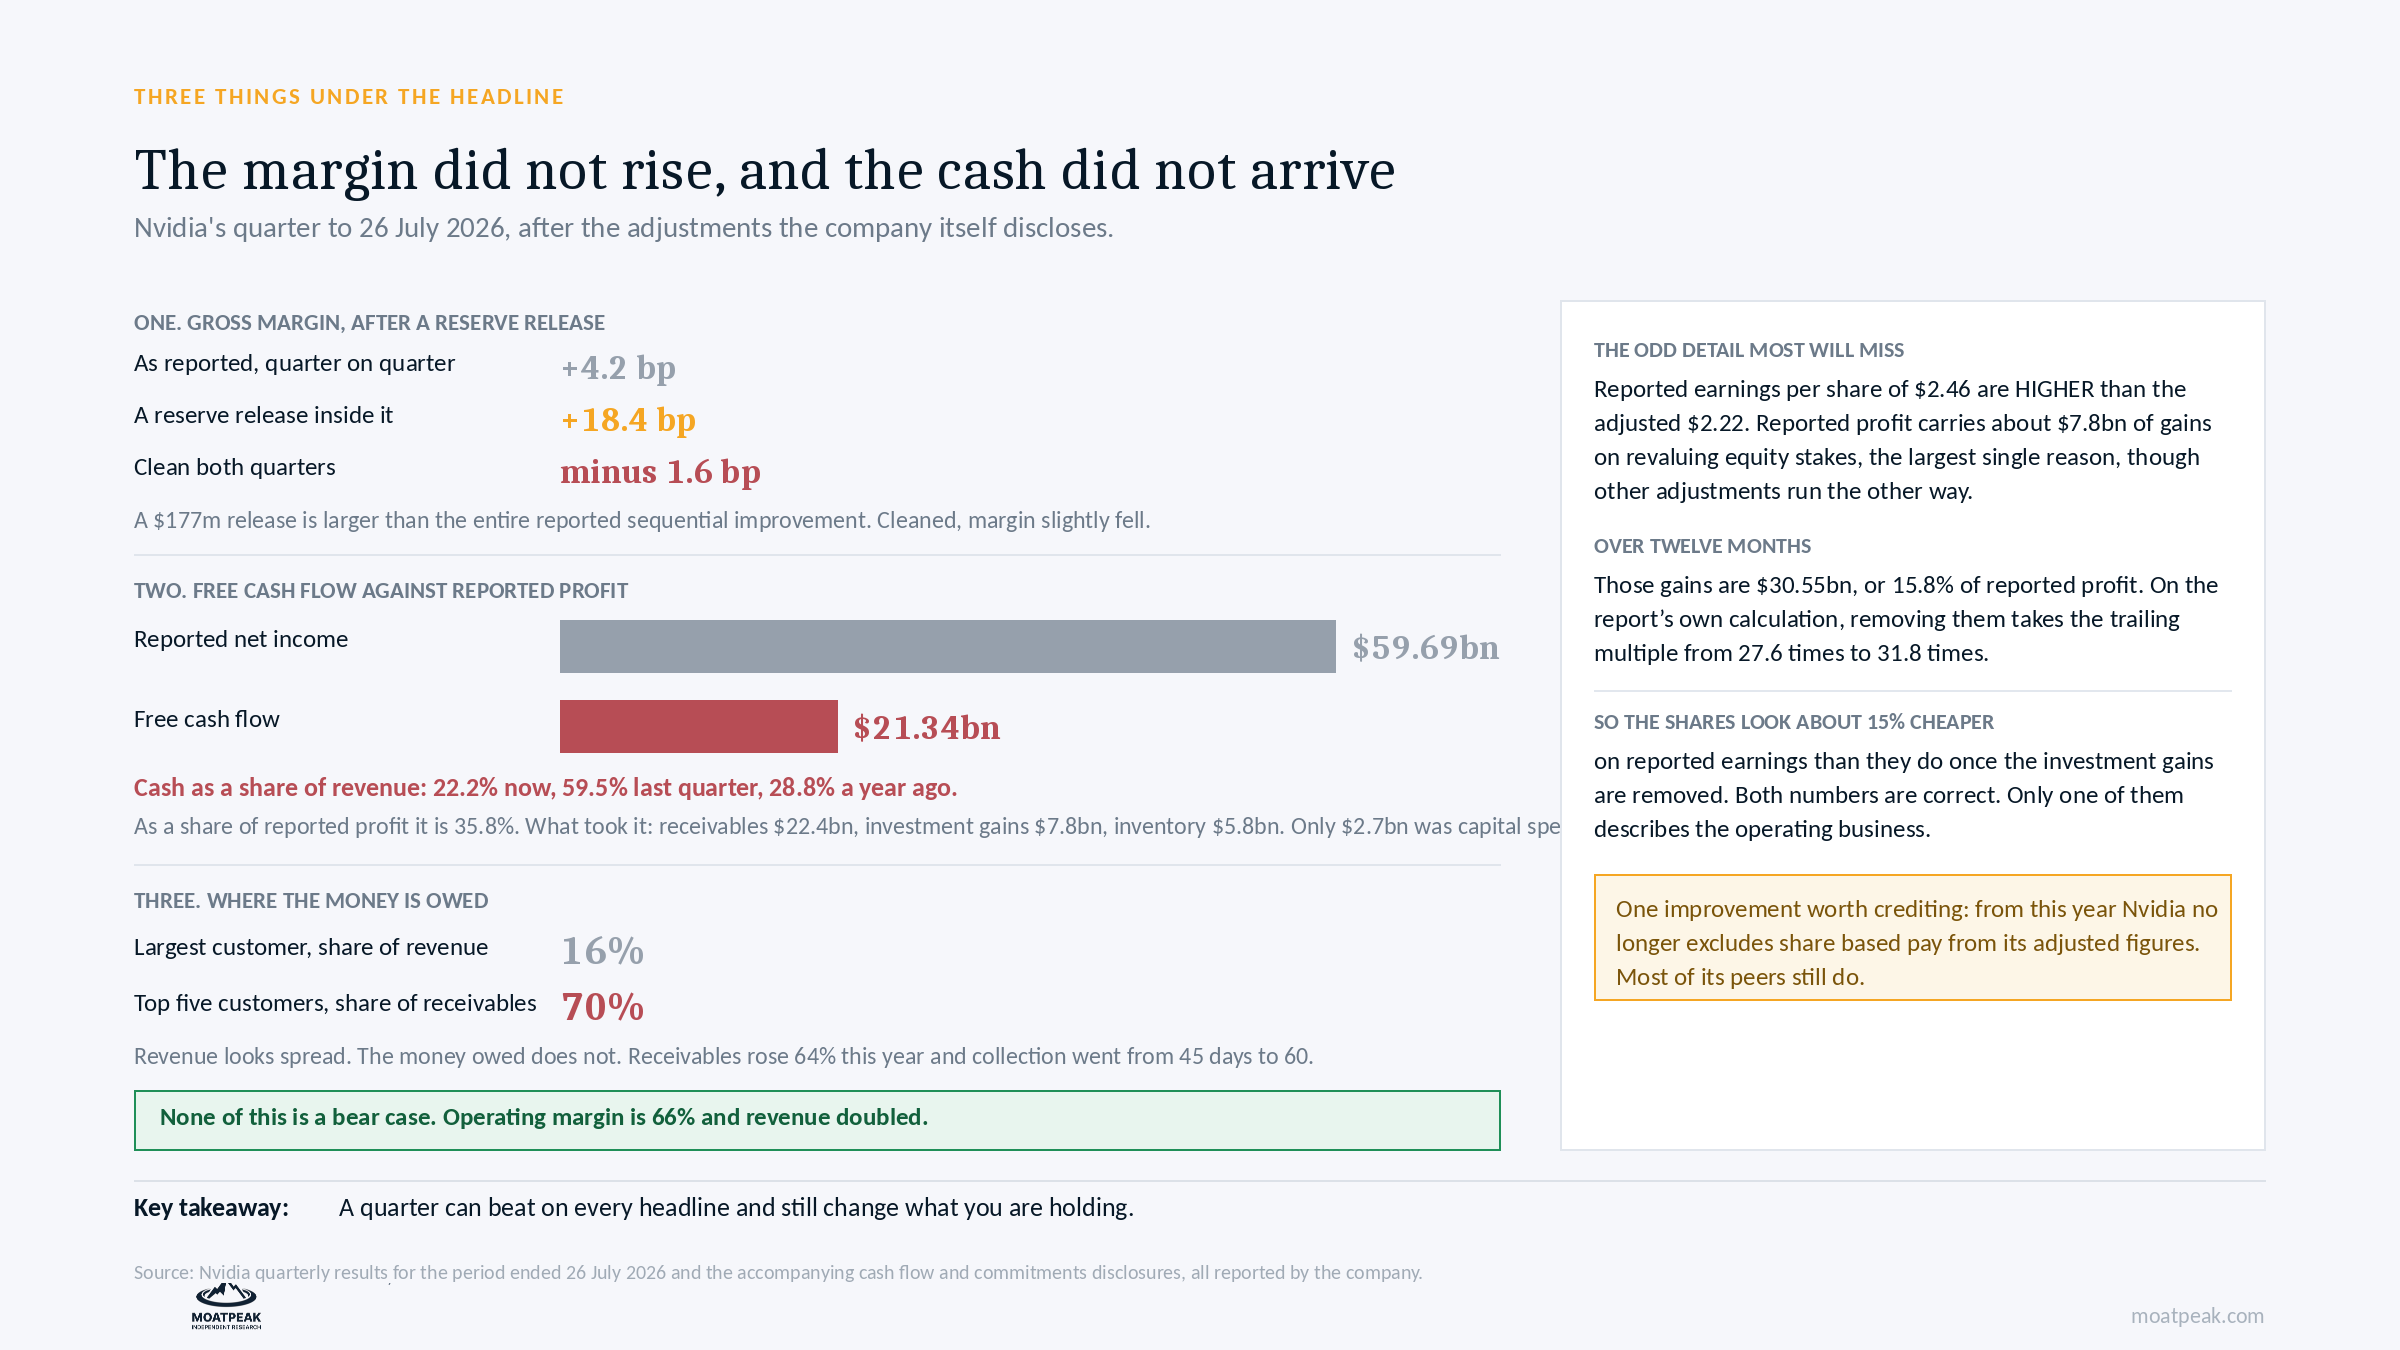
Looking at the margin the way the report does, a $177 million reserve release this quarter is actually bigger than the total reported improvement. If you adjust both quarters for reserve changes, the margin actually fell a bit instead of rising. The report shows the sequential change in two ways, so it’s better to quote the release, not just the basis points.
Free cash flow was $21.34 billion, which is 22.2% of revenue. That’s down from 59.5% last quarter and 28.8% a year ago. Compared to reported profit of $59.69 billion, free cash flow is 35.8%. Both ratios are in the report, but they mean different things.
What’s interesting is where the cash went. Receivables used up $22.4 billion, non-cash investment gains took out $7.8 billion, and inventory used $5.8 billion. Physical capital spending was just $2.7 billion. This is really about working capital, not spending.
Receivables have jumped 64% this year to $63.1 billion, and collection times have gone from 45 to 60 days. Inventory is up 111% over the year, but it looks like Nvidia is building up for the next product launch, not just sitting on unsold goods: raw materials are up 198%, while finished goods are down 21.9%.
Revenue appears diversified, but the money owed is not. The biggest customer makes up 16% of revenue, and the top five customers account for 70% of receivables.
A key detail that affects the valuation multiple
Reported earnings per share are $2.46, higher than the adjusted $2.22. That’s unusual. The main reason is about $7.8 billion in gains from revaluing equity stakes, though other adjustments go the opposite way, so the numbers don’t match up exactly.
Over the past twelve months, those gains add up to $30.55 billion, or 15.8% of reported profit. According to the report, taking out those gains changes the trailing multiple from 27.6 times to 31.8 times.
So, the shares seem about 15% cheaper if you use reported earnings, compared to when you exclude investment gains. Both numbers are accurate, but only one reflects the actual operating business.
On the positive side, starting this year Nvidia includes share-based pay in its adjusted numbers, unlike most of its peers. That’s a real step forward in disclosure quality and deserves recognition.
Here’s what we’re keeping an eye on, in terms of key levels:
What would make us more positive: if collection days move back toward 45, cash conversion rises above 35%, and the non-hyperscale segment keeps growing above 20% on a stable base. If two of these happen, most quality concerns would go away.
Our full work on the business, the moat and where we think the price sits against it is at moatpeak.com.
Educational research only. Not personalized investment advice. MB “MoatPeak Group”.