


What changed from last week
The prior edition ended with payrolls as the event that reopened the September-hike question. This week answered it with inflation. The two-year yield moved from 4.37% to 4.63%, the ten-year approached 5%, and the implied hike probability moved above 80%. Oil also crossed from a high-$80s/low-$90s problem into a triple-digit macro variable. At the same time, the inflation-compensation move was small relative to the rise in real yields, which means the market treated the Fed response as part of the solution rather than simply pricing an uncontrolled inflation shock.
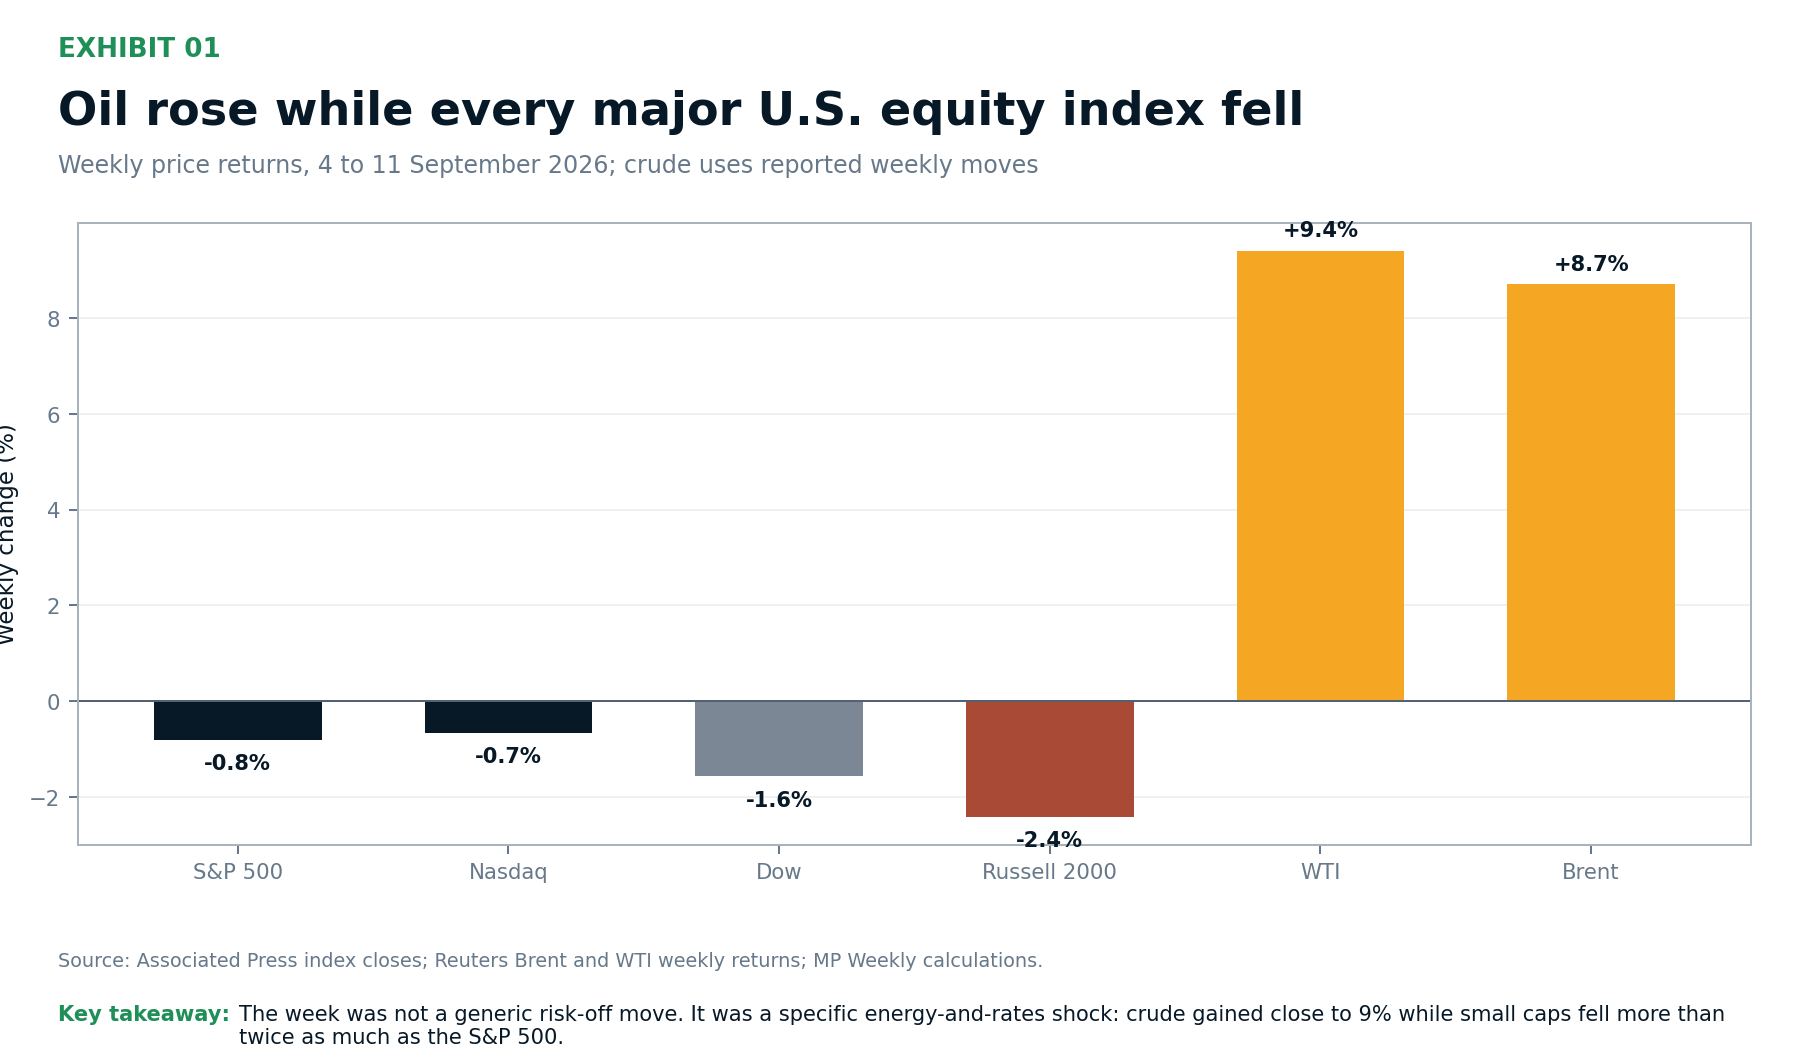
Figure 1. Oil rose while every major U.S. equity index fell
Key takeaway: The week was not a generic risk-off move. It was a specific energy-and-rates shock: crude gained close to 9% while small caps fell more than twice as much as the S&P 500.
Deep Dive I: CPI Made the Hike the Base Case
Friday’s CPI report mattered because the headline and the core told different stories. The headline increase of 0.4% was exactly what economists expected and was heavily influenced by gasoline. Gasoline rose 3.9% in August, energy rose 2.1%, and the BLS said gasoline accounted for more than one-third of the monthly all-items increase. That is the part a central bank can plausibly describe as an external relative-price shock.
The core was harder to dismiss. CPI excluding food and energy rose 0.3% in August after 0.2% in July, above the 0.2% Reuters consensus. Shelter rose 0.3%, airline fares 2.7% and communication 2.3%. Annual core inflation slowed to 2.4% from 2.5%, but the monthly acceleration arrived one week after a 162,000 payroll print and one day after a firm PPI report.
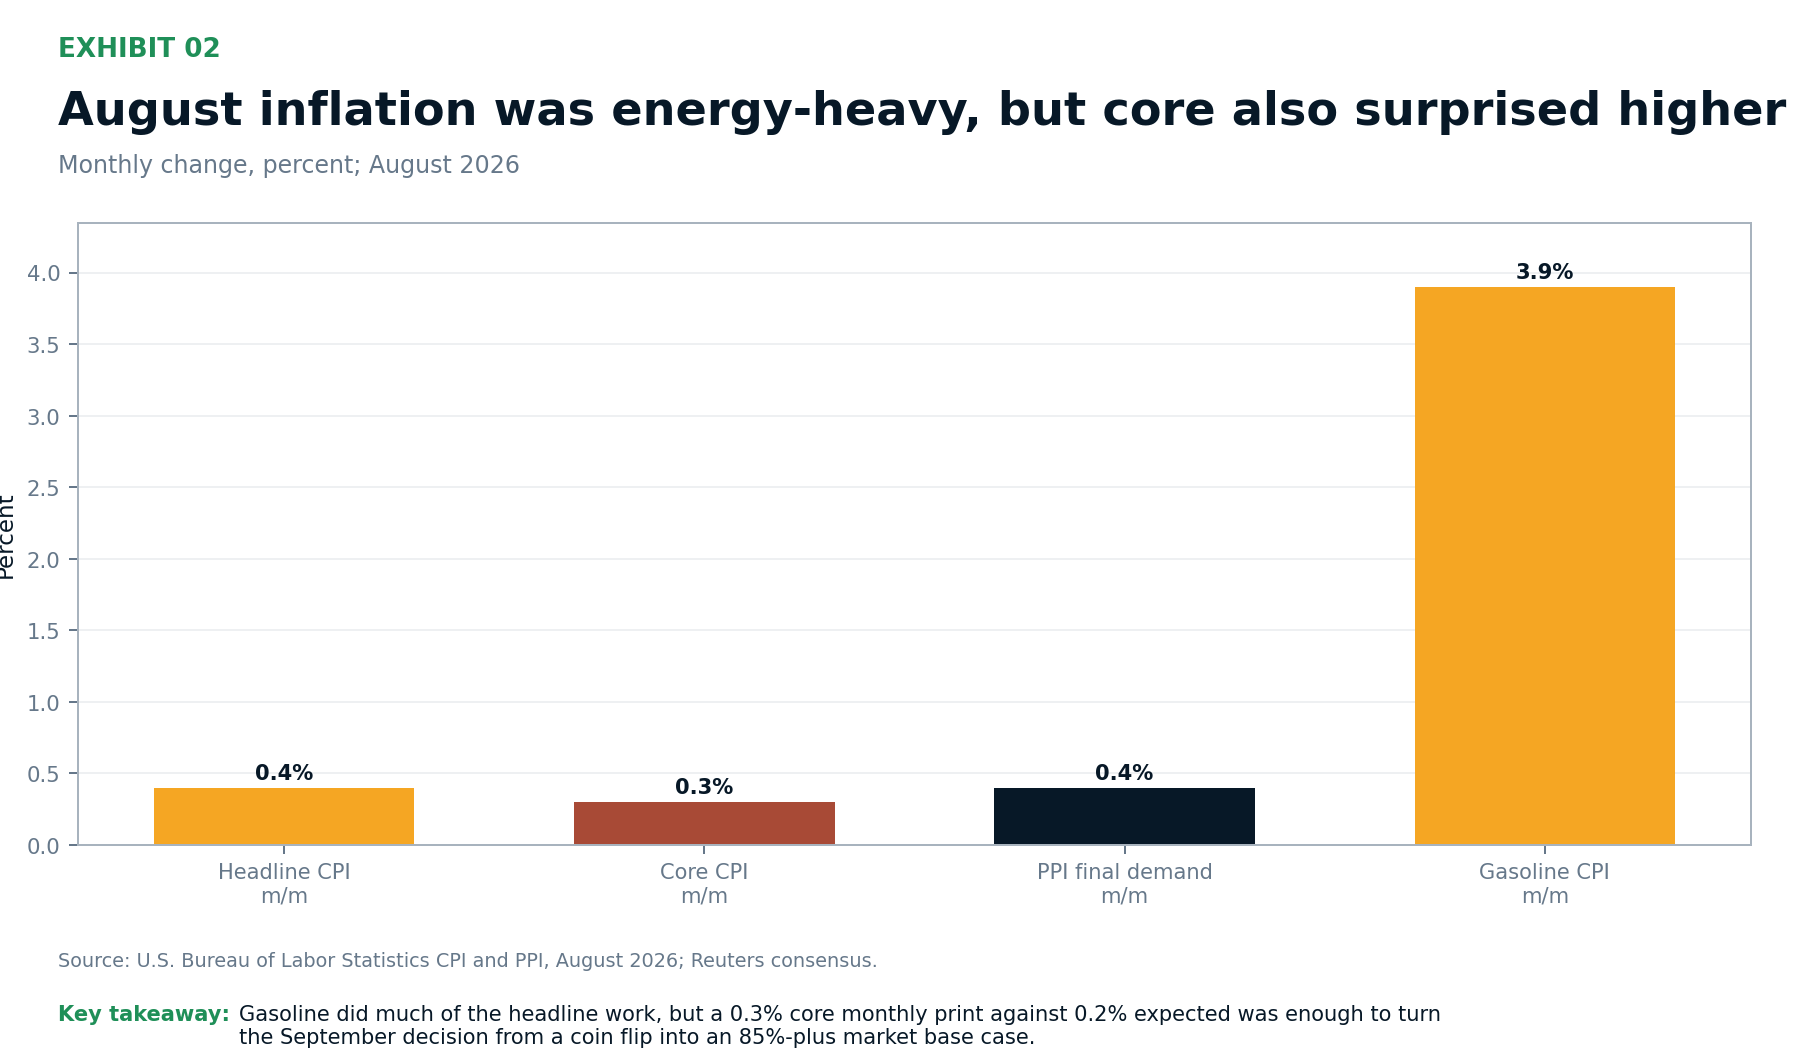
Figure 2. August inflation was energy-heavy, but core also surprised higher
Key takeaway: Gasoline did much of the headline work, but a 0.3% core monthly print against 0.2% expected was enough to turn the September decision from a coin flip into an 85%-plus market base case.
Why a stock rally can coexist with higher hike odds
The S&P 500 rose 0.86% on Friday even as short-rate markets moved further toward a hike. That is not automatically contradictory. A near-term hike can raise the front-end discount rate while lowering the perceived probability of a larger inflation problem later. Friday’s Treasury curve moved in that direction: short and intermediate yields rose, but the 30-year finished below Thursday’s 5.37% level at 5.35%. The equity rally also benefited from oil falling nearly 3% from Thursday’s highs.
What would make CPI less hawkish than it looks
If the August core rise proves concentrated in volatile categories such as lodging and airfares, and September energy prices reverse, the Fed’s preferred PCE measure could still look more benign. Reuters-cited economists put August core PCE around 0.2% to 0.3%. That makes the September decision likely, but the path after September remains more open than Friday’s headline odds imply.
Deep Dive II: The Curve Was Real, Even With Oil Above $100
The most useful arithmetic of the week is the Treasury decomposition. Five-year nominal yields rose 24 basis points from 4.54% to 4.78%. Five-year real yields rose 21 from 2.17% to 2.38%. Inflation compensation - nominal minus real at the same maturity - therefore rose only 3 basis points, from 2.37% to 2.40%. At ten years the same calculation gives +18 nominal, +17 real and only +1 compensation. At thirty years compensation was unchanged.
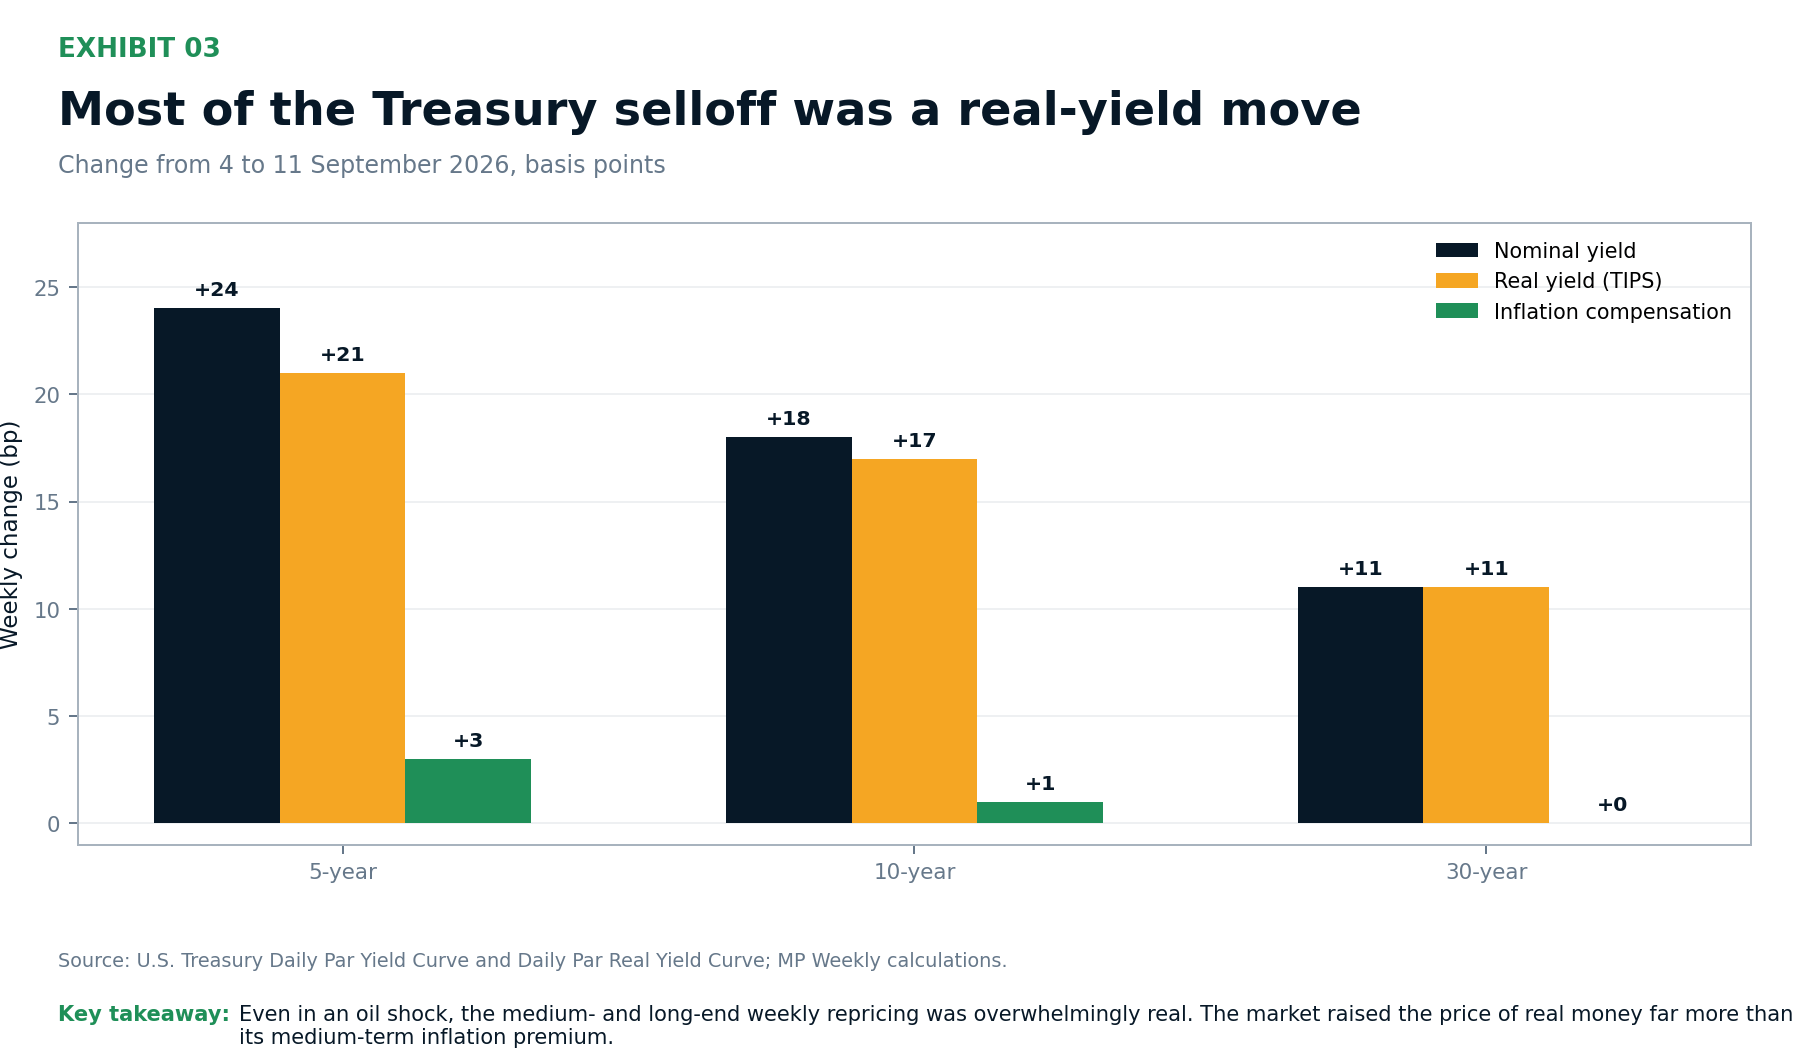
Figure 3. Most of the Treasury selloff was a real-yield move
Key takeaway: Even in an oil shock, the medium- and long-end weekly repricing was overwhelmingly real. The market raised the price of real money far more than its medium-term inflation premium.
This is why the week is more than an oil story. If investors had simply concluded that $100 oil would feed continuously into inflation, inflation compensation should have widened much more. Instead, the market also priced a more forceful policy response and a higher real discount rate. That combination is particularly difficult for smaller companies, leveraged balance sheets and long-duration growth assets whose valuations depend on distant cash flows.
The 10-year near 5% is the next threshold
The ten-year Treasury finished Friday at 4.96%, its highest level since 2023 in contemporary market reports. Five percent is not economically magical, but it is behaviourally important: it is a visible alternative return against equities and a reference point for mortgage, corporate and private-market discount rates. A clean break above 5% with credit spreads stable would be a rates problem; a break above 5% with widening high-yield spreads would be a broader financial-conditions problem.
Deep Dive III: Oil Moved from Commodity to Policy Variable
Brent ended the week at $104.61 and WTI at $100.05 after supply disruptions and escalating Middle East hostilities. Reuters calculated weekly gains of more than 8% for both benchmarks. U.S. diesel prices also reached record territory. The point is no longer simply that energy equities receive an earnings tailwind. Oil now sits inside the Fed reaction function through three channels: headline inflation, household expectations and the risk of pass-through into transportation-intensive services and goods.
August CPI already shows the first channel. Gasoline rose 3.9% month on month and 27.4% from a year earlier; the energy index was up 16.3% year on year. Michigan shows the second: one-year inflation expectations jumped to 4.6% from 4.0% as the survey explicitly cited fuel prices and trade tensions. The third channel - broad pass-through - is the one that remains unproven.
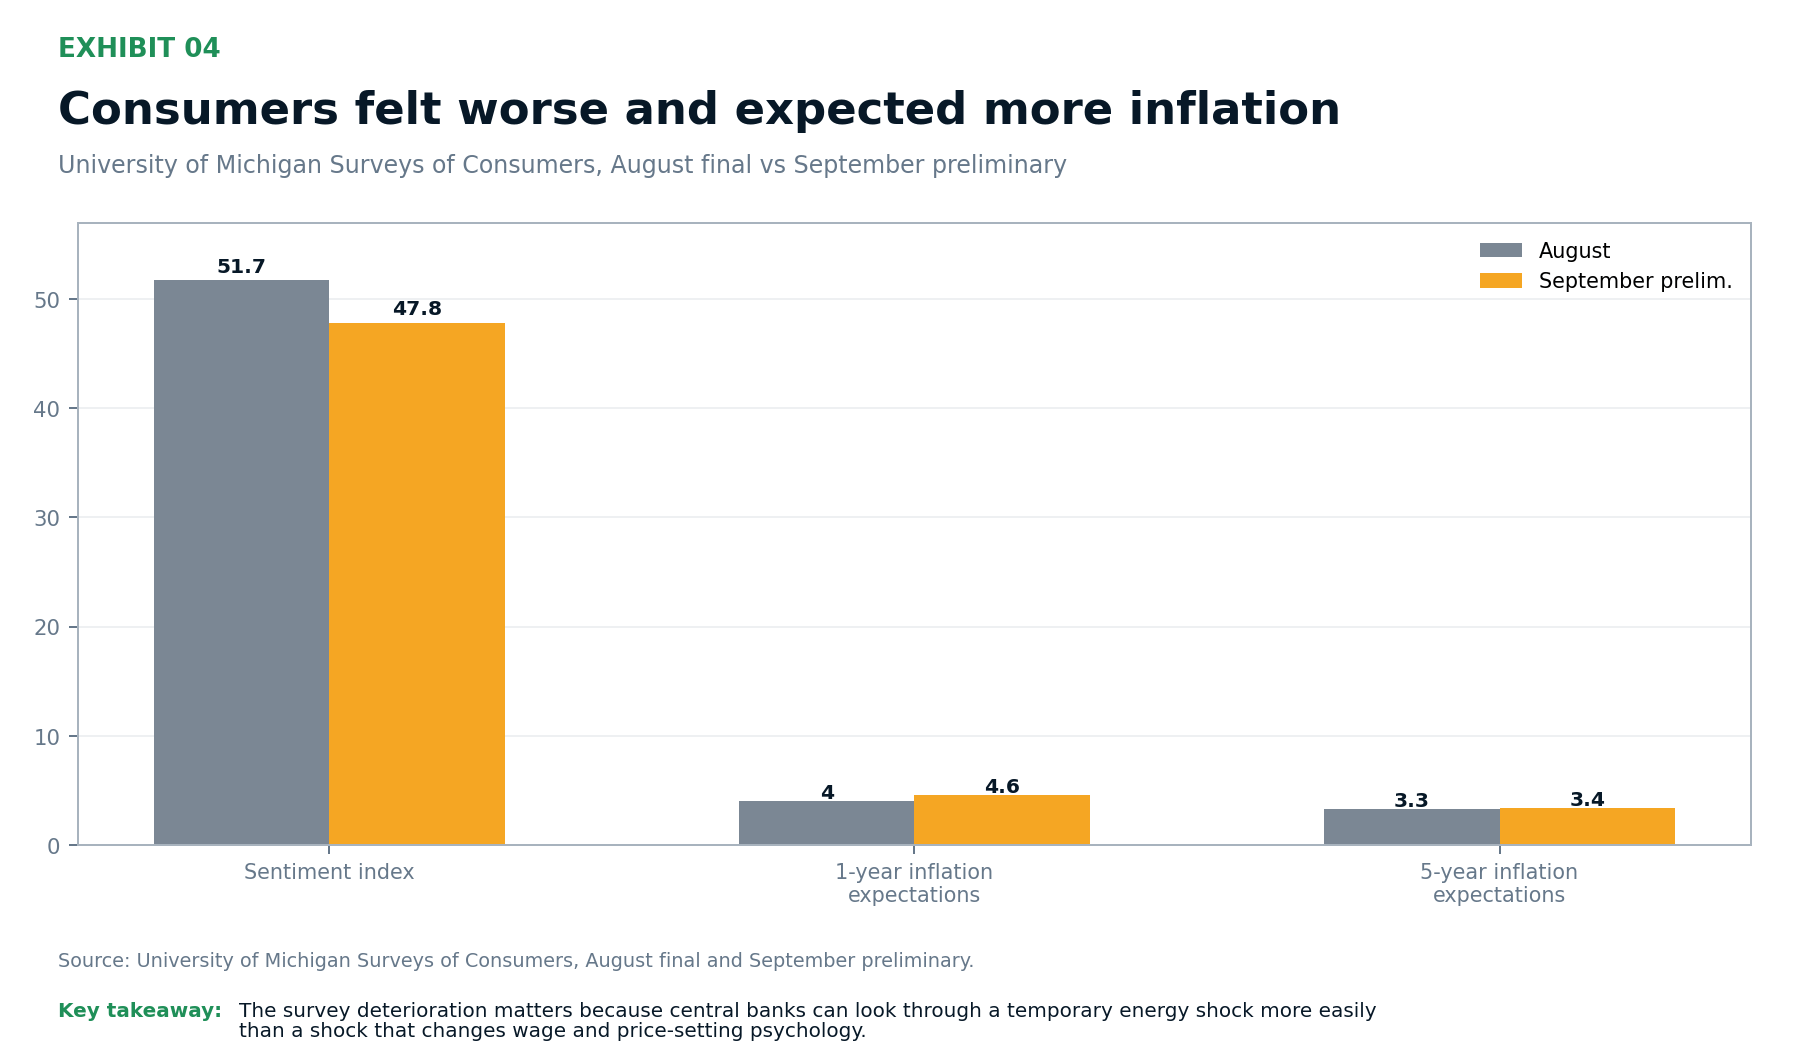
Figure 4. Consumers felt worse and expected more inflation
Key takeaway: The survey deterioration matters because central banks can look through a temporary energy shock more easily than a shock that changes wage and price-setting psychology.
What oil would need to do to change the Fed path
A sustained move above roughly $105-$110 matters more than a one-day spike because it extends the period during which gasoline, diesel and freight costs remain visible to households and firms. A retracement below $95 before the October meeting would relieve some of the pressure. The key weekly observation is that Friday’s 2%-3% oil pullback was enough to help equities rally even though CPI itself was not dovish.
Deep Dive IV: Earnings Still Mattered - Oracle and Adobe
Macro dominated, but the week also delivered a useful AI monetisation check. Oracle reported fiscal first-quarter revenue of $19.34 billion, up 30% year on year, with cloud revenue of $11.61 billion and cloud infrastructure growth of 62%. Remaining performance obligations reached $664 billion after more than $30 billion of new AI cloud contracts, while the company guided to at least $90 billion of full-year revenue. The trade-off is capital intensity: Oracle expects roughly $90 billion to $95 billion of annual capital expenditure.
Adobe also beat third-quarter revenue expectations at $6.76 billion, up about 13% year on year, and said AI-first annual recurring revenue more than doubled. But the shares fell after hours because fourth-quarter revenue guidance of $6.80-$6.85 billion put the midpoint slightly below consensus. The same pattern seen in prior AI reports remains: evidence of demand is necessary, but valuation and forward expectations decide the stock reaction.
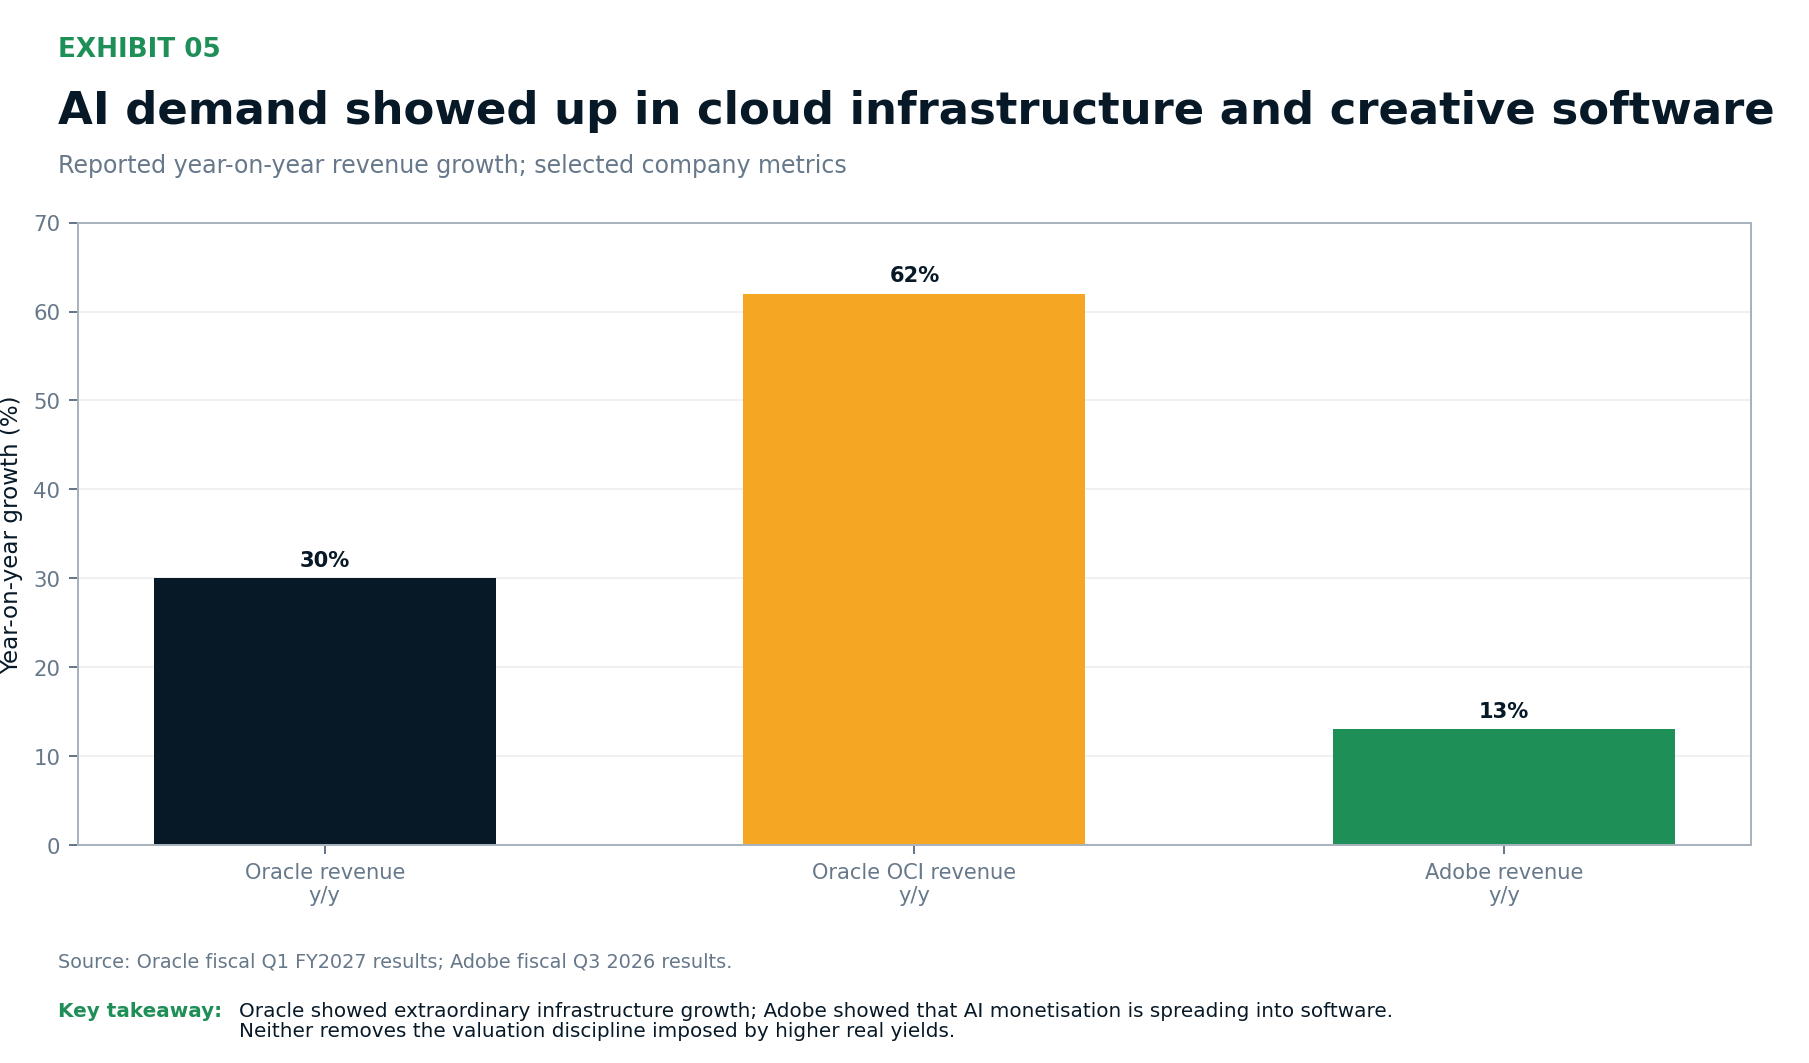
Figure 5. AI demand showed up in cloud infrastructure and creative software
Key takeaway: Oracle showed extraordinary infrastructure growth; Adobe showed that AI monetisation is spreading into software. Neither removes the valuation discipline imposed by higher real yields.
Why this matters in a 5% 10-year world
The cost of capital is now colliding directly with the AI capex cycle. Oracle can report 62% infrastructure growth and still face investor questions about financing $90-plus billion of annual capex. Adobe can beat quarterly revenue and still fall if next-quarter guidance misses by a few tens of millions. Higher real yields make the market less willing to capitalize distant cash flows at premium multiples, even when the demand thesis is intact.
What the Market May Be Missing
The inflation shock and the bond shock were not the same thing
Observation. Oil rose almost 9%, headline CPI accelerated and Michigan inflation expectations rose, yet five- and ten-year inflation compensation barely changed on the week.
Why it is non-obvious. The natural narrative is “oil up, inflation up, yields up.” The decomposition says most of the yield move was real. That is consistent with investors expecting the Fed to respond rather than lose control of inflation.
Investment relevance. A real-yield shock is more directly hostile to high-multiple equities than a pure breakeven shock, while inflation-linked bonds offer less protection than they would in a compensation-led selloff.
Friday was a credibility rally, not a dovish rally
Observation. Stocks rose almost 1% even as hike odds moved above 85%.
Why it is non-obvious. Higher rate expectations are usually described as bad for stocks. But a decisive hike can reduce uncertainty and cap the long-end inflation premium. Friday also coincided with a material oil pullback.
Investment relevance. The market may tolerate one hike more easily than an open-ended rise in oil and long yields. The distinction between a one-off adjustment and a hiking cycle will dominate the next meeting.
Portfolio lens
On rates, the week says to distinguish real duration from inflation duration. The five-year nominal move was almost entirely real. Portfolios sensitive to valuation multiples can be exposed even if breakevens are stable.
On energy, $100 oil now matters beyond the energy sector. It changes transport costs, household sentiment, inflation expectations and the policy distribution. A portfolio that treats energy solely as a sector allocation misses the macro transmission.
On equity size, the Russell 2000 fell 2.4% while the S&P 500 lost 0.8%. Higher real yields and tighter policy expectations land harder on smaller companies with shorter financing runways and more variable-rate exposure.
On AI, Oracle and Adobe show that earnings remain strong enough to support the fundamental thesis. The harder question is whether those cash flows are valuable enough at a 10-year Treasury near 5%.
The Week Ahead: 14 to 18 September 2026
The coming week contains the event that this report has been repricing toward: the FOMC decision on Wednesday 16 September. The meeting also includes a Summary of Economic Projections, so the path matters at least as much as the first 25 basis points.
What We Are Watching
The 10-year Treasury yield, 4.96%. A sustained close above 5.05% after the FOMC would say the market sees more than a one-off hike; a move below 4.85% would suggest the event premium is clearing.
The two-year yield, 4.63%. Above 4.75% would imply a renewed cycle is being priced. Below 4.50% after a hike would be a classic one-and-done signal.
Five-year inflation compensation, about 2.40%. A break materially above 2.45% with real yields still rising would mean the market is beginning to doubt policy credibility rather than simply price tighter policy.
WTI at $100.05 and Brent at $104.61. WTI below $95 would remove a major source of near-term inflation anxiety; above $105 would keep household expectations and transportation pass-through in focus.
Michigan one-year inflation expectations at 4.6%. The 25 September final reading is the cleanest confirmation or rejection of the expectation shock.
Russell 2000 versus the S&P 500. Small caps underperformed by roughly 1.6 percentage points this week. A reversal after the Fed would indicate that the market is comfortable with the financing outlook.
Oracle and the broader AI infrastructure complex. If estimate upgrades cannot offset a higher real discount rate, the market is telling us the binding constraint has moved from demand to valuation and financing.