


The S&P 500 gained 0.09% last week, while RSP, an ETF tracking its equal-weight counterpart, fell 0.77%. The headline index held steady, but a more evenly spread portfolio of large-cap stocks lost ground.
Our thesis in one sentence: rising oil prices helped lift inflation compensation early in the week, while Friday’s payroll surprise pushed up short-term nominal yields and five-year real yields; equity gains remained concentrated in the larger stocks.
Four developments shaped our view.
First, Friday’s jobs report eased concerns about the labour market. August payrolls rose by 162,000 against a Reuters consensus of 56,000. June and July were revised up by 55,000 in total, with July’s 23,000 decline becoming a 21,000 gain. Unemployment held at 4.1%, participation rose 0.2 percentage point to 61.6%, and annual wage growth slowed to 3.1%. September rate-hike odds briefly reached about 65%, then eased to 57% in Reuters’ afternoon snapshot.
Second, most of the weekly bond move preceded payrolls. From 28 August to 4 September, the five-year nominal yield rose 6 basis points while its real yield fell 1, lifting inflation compensation by 7. At ten years, nominal and real yields rose 5 and 1 basis points respectively; at thirty years, they rose 2 and zero. Inflation compensation did more of the work this week, reversing the previous week’s pattern.
Third, hiring still looks cautious. July JOLTS recorded 7.3 million openings and 5.1 million hires; ADP estimated 38,000 additional private-sector jobs in August; and initial claims were 206,000. The ISM Services Employment Index remained below 50 at 47.8, despite activity and orders readings above 60. These measures cover different periods and samples, but none points to a surge in layoffs.
Fourth, Broadcom’s AI sales exceeded its guidance, but the shares fell. Q3 AI semiconductor revenue reached $16.7 billion against a $16.0 billion forecast, and Q4 guidance rose to $21.7 billion. Shares nevertheless lost 2.7% on Thursday after total Q4 revenue guidance of about $34.8 billion fell short of the roughly $35.0 billion consensus cited by Reuters. Strong demand alone was not enough to satisfy investors.
The main challenge to our view is that oil prices can reverse quickly. Inflation compensation also includes risk and liquidity premia, so it cannot be read as a pure inflation forecast. Productivity offers another counterweight: Q2 output per hour rose 1.4% annualised, while unit labour costs increased just 1.2%, or 1.4% over the year. That is little evidence of a wage-cost spiral.
Our view would weaken if PPI and CPI are benign, Brent falls below $90, and five-year inflation compensation drops below 2.30% without a growth scare. That would suggest a temporary geopolitical premium rather than a lasting shift in inflation pricing.
Deep Dive I: Payrolls Beat. Hiring Still Looks Selective.
August payrolls beat expectations by a wide margin: 162,000 jobs were added against a Reuters consensus of 56,000. June and July were also revised up by a combined 55,000. July’s initially reported loss of 23,000 became a gain of 21,000, making the summer labour market look firmer than the earlier releases had suggested.
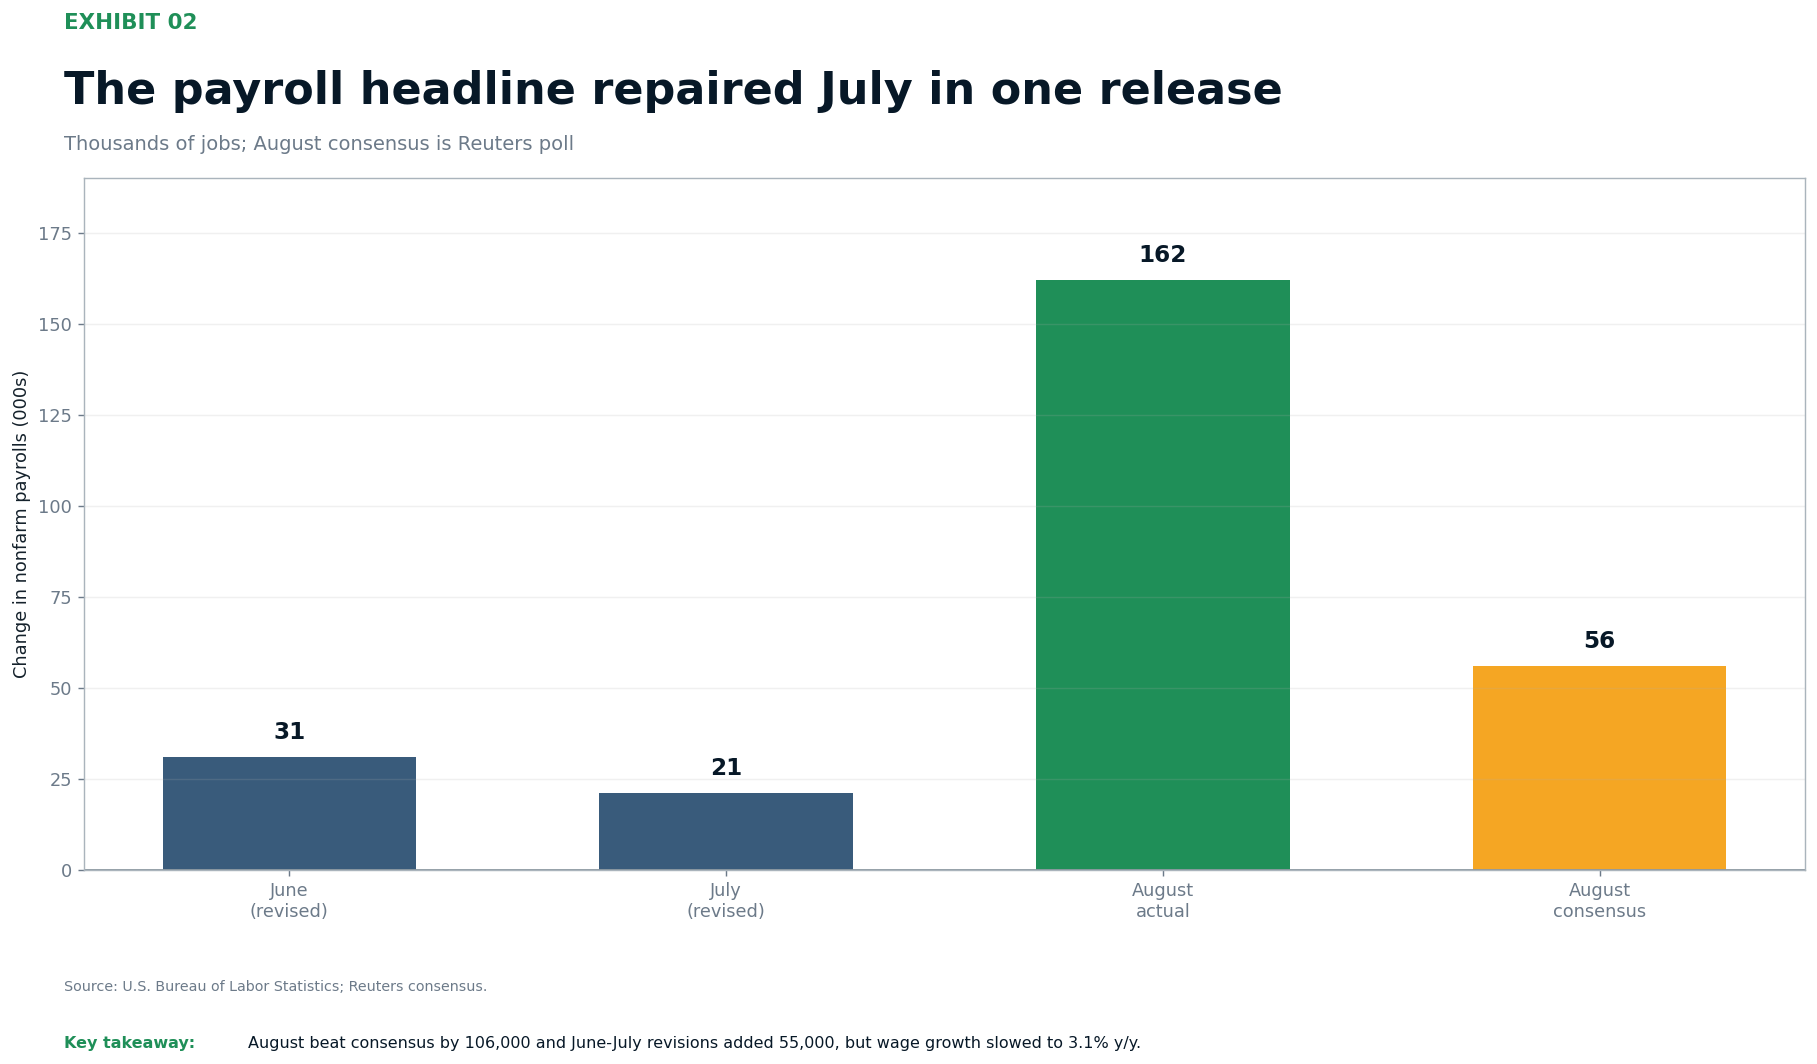
Figure 1. August payrolls repaired the headline
Key takeaway: August job growth, upward revisions and higher participation strengthened the report. Slower wage growth tempered the inflation concern.
Higher participation added some reassurance
The labour force grew by 683,000 and household employment by 569,000. Participation rose from 61.4% to 61.6%, while unemployment held at 4.1%. More people were looking for work and finding it, although household estimates are volatile: the employment increase was below the BLS’s roughly 650,000 significance threshold. Participation also remained 0.5 percentage point below January.
Average hourly earnings rose 0.3% in August and 3.1% over the year, down from July’s 3.2% annual pace. The average workweek increased by 0.1 hour to 34.4 hours. Together, the figures strengthen the case that the economy can withstand tighter policy, while offering little evidence that wage growth is accelerating.
Payrolls and hiring flows tell different parts of the story
These releases are not directly comparable. Payrolls measure net employment changes; JOLTS tracks openings, hires and departures; initial claims count applications for unemployment benefits; and ADP estimates private employment using a separate dataset. BLS private payrolls rose 127,000 in August, compared with ADP’s 38,000. The gap is worth watching, but one month’s disagreement does not establish a trend.
Job gains were also uneven. Restaurants and bars added 59,000 jobs and local government education added 42,000, together representing about 62% of the net increase. Manufacturing gained 16,000 and health care 13,000, while information lost 23,000. Education’s rebound partly reversed July’s decline, making seasonal effects relevant to the interpretation.
What the Fed learned
The report weakened the argument for holding rates solely because employment was faltering. Reuters’ market wrap put September hike odds at about 55% before the release, 65% immediately afterwards and 57% by the afternoon. Those are time-specific market estimates, not a Fed commitment. Next week’s inflation data will help determine whether the stronger jobs report leads to tighter policy.
What would change this view: another strong payroll report alongside wage growth above 3.5% would increase our inflation concern. Claims above 230,000 and renewed downward payroll revisions would point the other way. These are monitoring thresholds, not statistical rules.
Deep Dive II: Inflation Compensation Took the Curve Back
The previous week’s Treasury move was led by real yields, while inflation compensation fell. This week the balance reversed. The five-year nominal yield rose from 4.48% to 4.54%, and the real yield slipped from 2.18% to 2.17%. Subtracting the latter from the former gives an increase in inflation compensation from 2.30% to 2.37%.
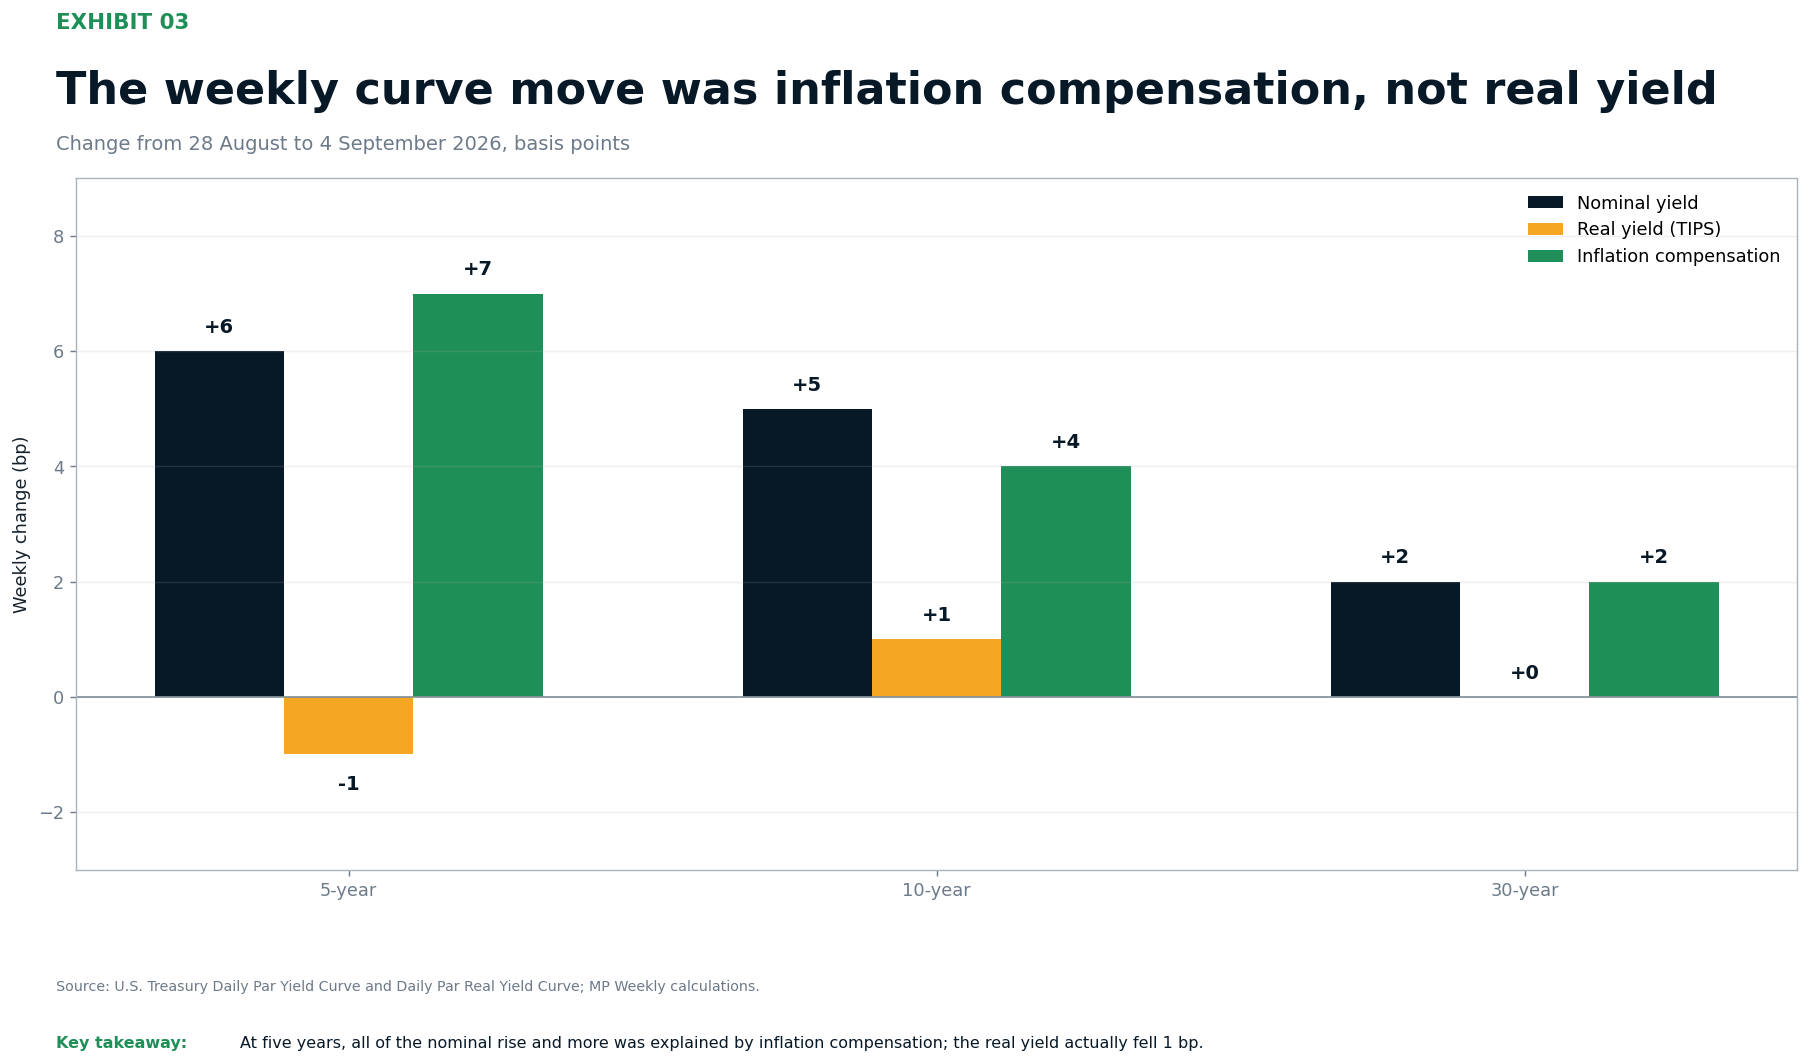
Figure 2. Inflation compensation drove the measurable weekly repricing
Key takeaway: Medium- and long-term nominal yields rose with little change in real yields. Most of the increase appeared in inflation compensation.
At ten years, nominal yields rose 5 basis points and real yields 1, leaving a 4-basis-point rise in inflation compensation. At thirty years, real yields were unchanged and nominal yields rose 2. Treasury’s published real par curve starts at five years, so it does not support the same calculation for the two-year maturity.
Inflation compensation is estimated here as the nominal Treasury yield minus the real TIPS yield at the same maturity. It includes inflation-risk and liquidity premia as well as expected inflation. Differences in the instruments and curve construction also mean this is an approximate measure, rather than a directly tradable breakeven.
The timing helps distinguish the two moves
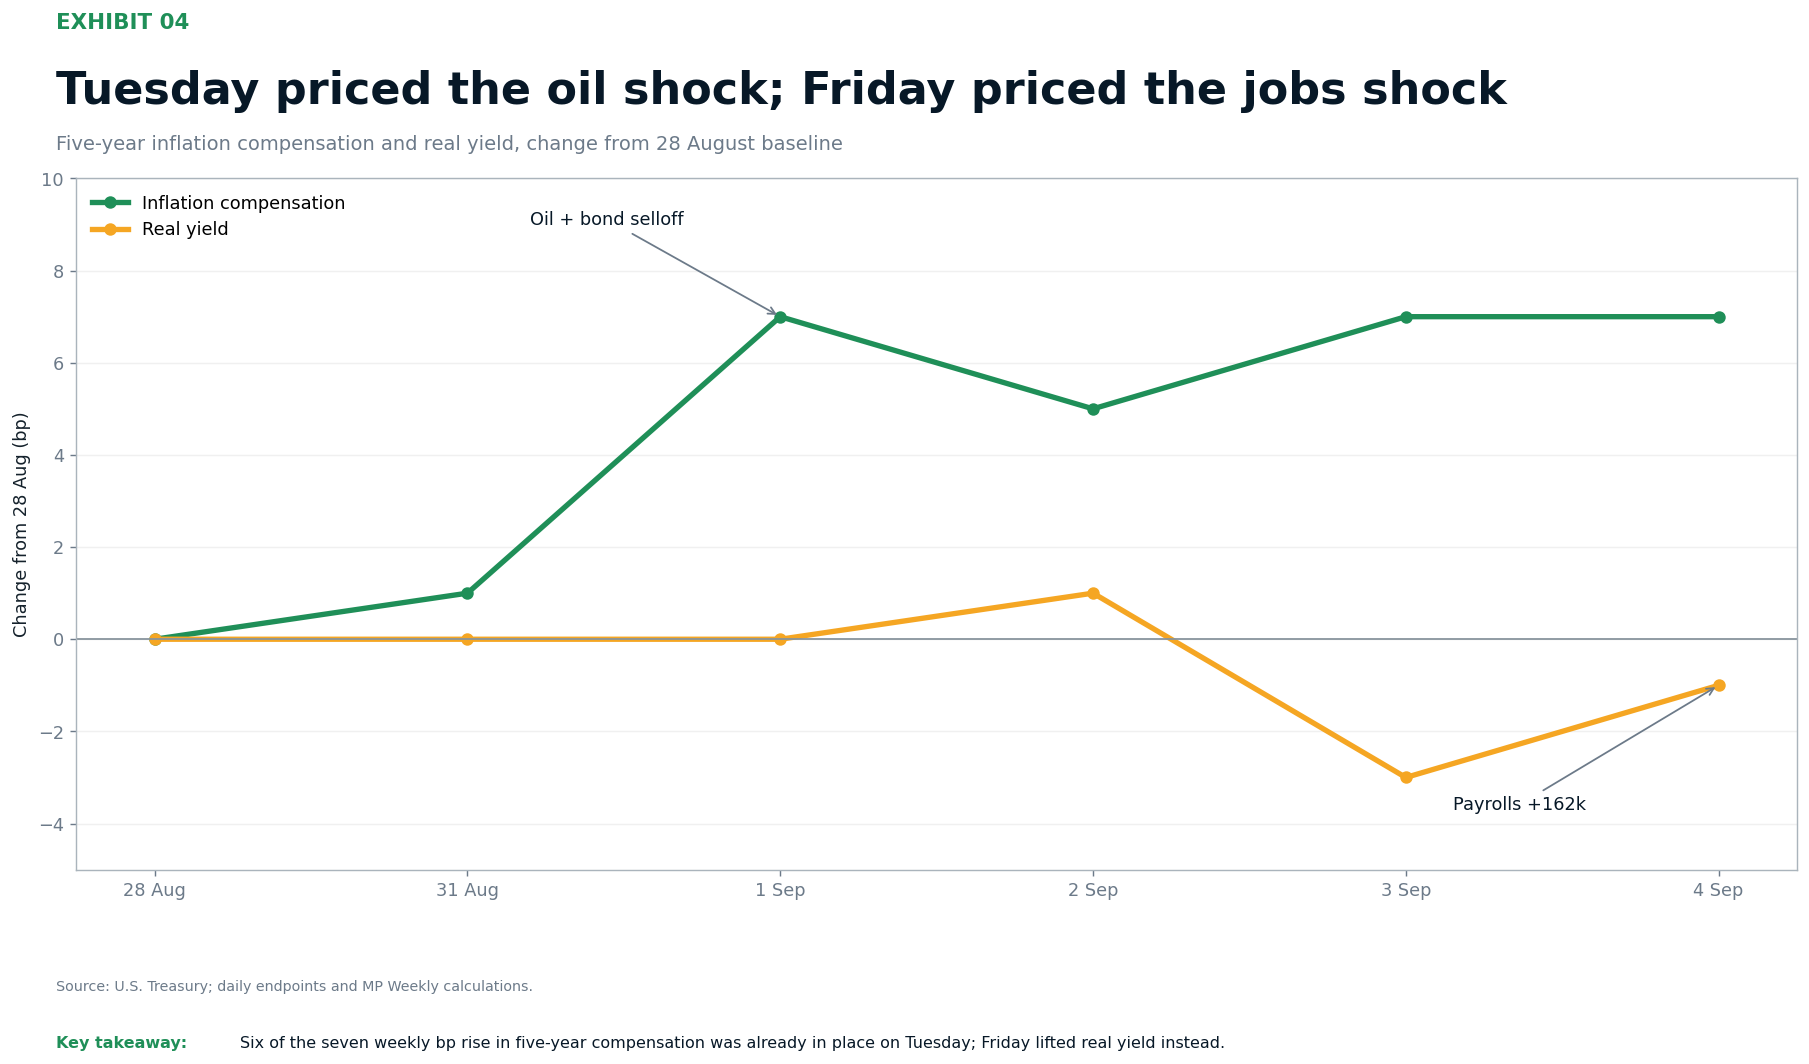
Figure 3. Tuesday and Friday were different rate events
Key takeaway: Five-year inflation compensation rose most on Tuesday. Friday’s jobs report coincided with a rise in the real-yield component.
Five-year inflation compensation rose from 2.30% on 28 August to 2.31% on Monday and 2.37% on Tuesday, then ended Friday at 2.37%. The five-year real yield was unchanged through Tuesday, fell on Thursday as Governor Waller signalled he could support a hold if inflation eased, and recovered 2 basis points on Friday. Friday only partly reversed Thursday’s decline.
Rising oil prices offer a plausible explanation for the earlier move. WTI gained 9.7% over the week to $91.48, while Reuters reported a 7.6% rise in Brent. Renewed U.S.-Iran fighting increased supply concerns as Hormuz shipping remained disrupted. On Tuesday, Brent gained 4.6% and the ten-year Treasury yield reached 4.79%. The timing supports an energy link, although it does not prove causation.
Long-term yields moved less
The thirty-year nominal yield rose only 2 basis points over the week, with no change in its real yield. The two-to-ten-year spread widened from 39 to 41 basis points. That modest steepening is consistent with an inflation premium and some policy repricing; it offers little evidence of a disorderly selloff concentrated in long-dated bonds.
Gold fell on Friday and the dollar initially rose after payrolls, then surrendered part of its gain. Both respond to several forces at once. The Treasury calculation helps identify which yield component moved, but it cannot isolate the cause. Our interpretation rests on the combination of that arithmetic, the release timing and the oil-price move.
Falsification threshold: five-year inflation compensation below 2.30%, alongside WTI below $85, would support a temporary geopolitical explanation. A rise above 2.40% after firm CPI data would strengthen the inflation concern. Neither threshold is conclusive on its own.
Deep Dive III: Hot Services Demand, Cold Services Hiring
Thursday’s ISM Services report showed the tension facing policymakers before payrolls arrived. The headline PMI rose from 54.1 to 55.4, while Business Activity reached 61.7 and New Orders 60.9. Employment remained below 50 at 47.8. Firms reported expanding business alongside falling employment, even though the employment index improved slightly from July.
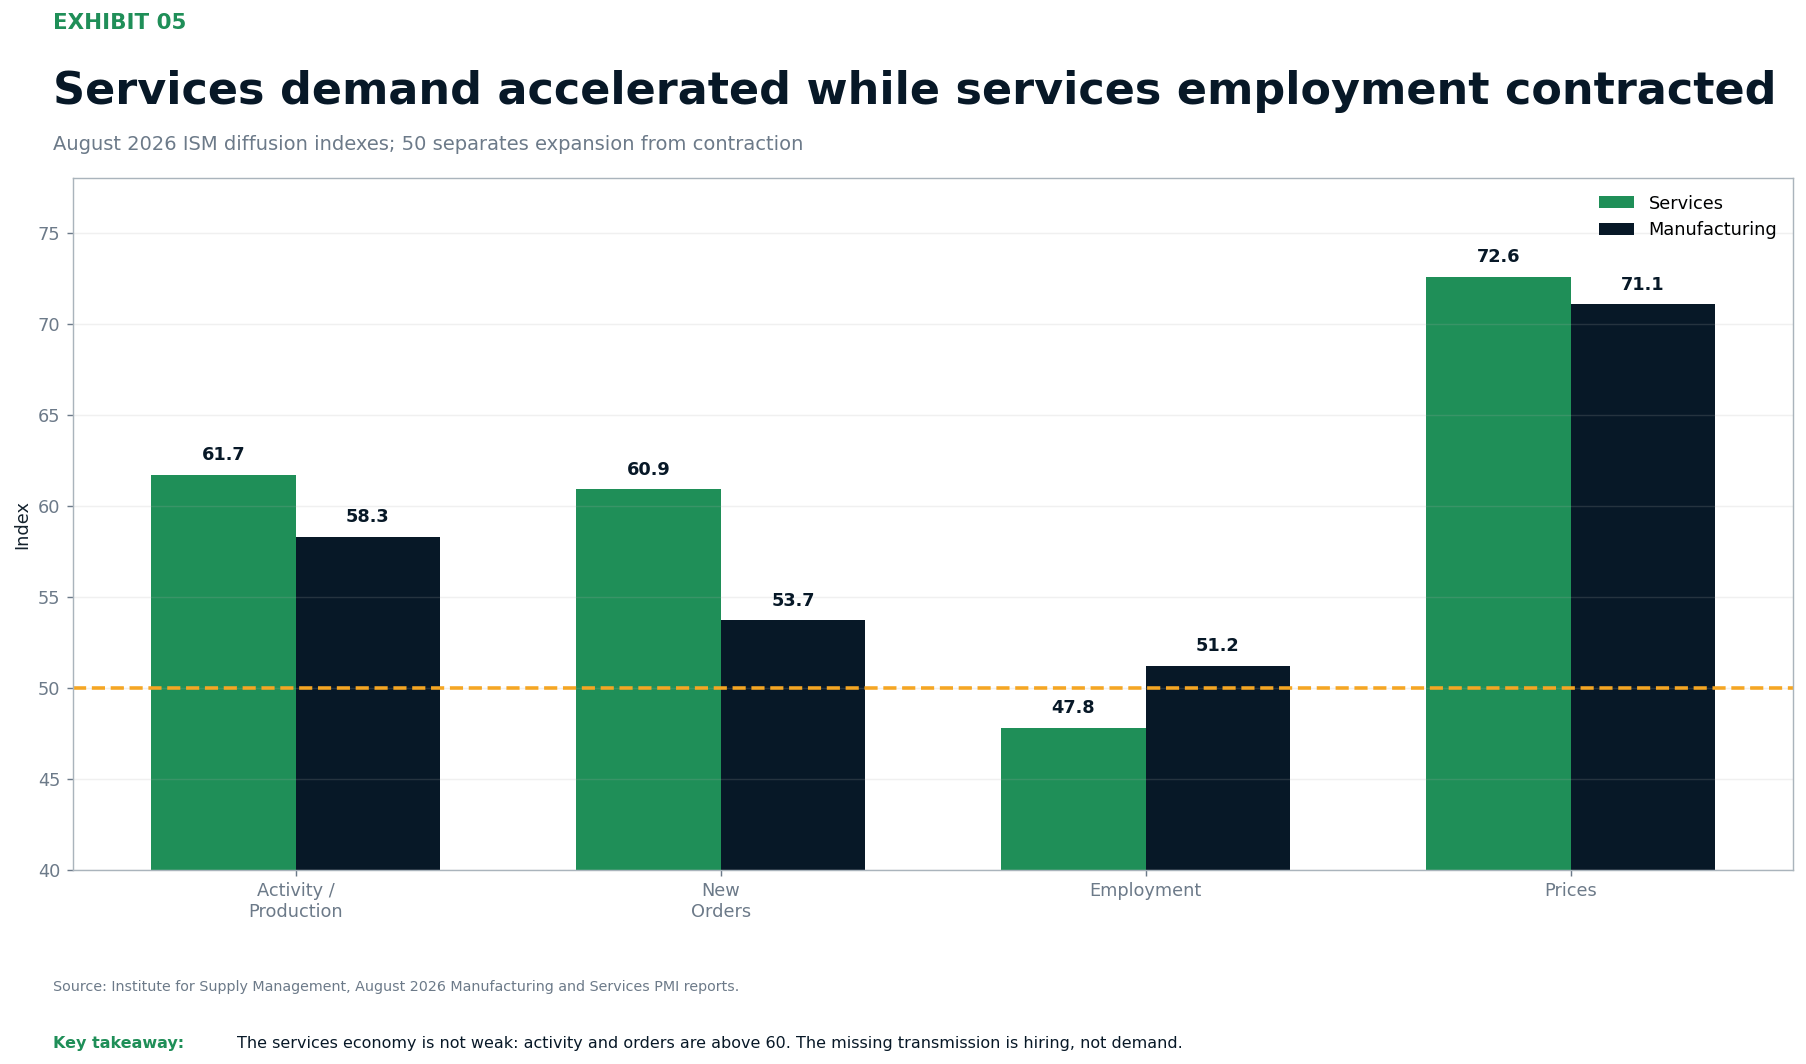
Figure 4. Services activity expanded while employment contracted
Key takeaway: Strong activity and weak employment can coexist. Productivity, hours or capacity utilisation may help explain the gap, but the survey does not identify the cause.
Price pressures remained high. Services Prices rose from 70.3 to 72.6, matching its highest level since August 2022. Manufacturing Prices stayed at 71.1, while the headline Manufacturing PMI eased from 55.6 to 54.6. These are measures of how widely firms report changes, not the percentage rate of inflation or output growth.
The services survey complicates a simple overheating story. Orders were growing, but employment was still contracting. Firms may be meeting demand with existing capacity or better productivity. They may also be reluctant to hire while costs are uncertain. Rising oil prices could squeeze margins or encourage price increases before they change staffing plans.
Productivity is the counterweight to the inflation story
Revised Q2 nonfarm business productivity rose 1.4% annualised, as output increased 1.7% and hours worked 0.3%. Unit labour costs rose 1.2% annualised and 1.4% over the year. Manufacturing productivity increased 2.4%, while its unit labour costs fell 0.3%. These figures suggest contained labour-cost pressure, although they cover Q2 rather than the latest oil shock.
The Beige Book points to modest growth
The Fed’s Beige Book described modest overall growth and a very small rise in employment. Demand for workers weakened in retail and hospitality, while consumer spending edged up and tourism increased. Price rises were unchanged in pace in eight Districts, slower in three and faster in one. Input costs remained elevated. The picture is one of continued growth with uneven hiring and persistent cost pressure.
The report used information collected on or before 24 August, so it predates this week’s renewed escalation. It helps establish the underlying business conditions but cannot tell us how firms have responded to the latest rise in energy prices.
The non-obvious point: energy can raise inflation risks even when hiring is subdued. The services survey and Q2 labour-cost data are consistent with that possibility, but their different coverage and timing mean they cannot establish how firms are responding today.
Deep Dive IV: Broadcom Validated Capacity, Not the Multiple
Broadcom offered a useful test of whether strong AI infrastructure demand could translate into renewed share-price leadership. Its results supported the demand case: Q3 revenue reached $29.6 billion, up 86% year on year. AI semiconductor revenue was $16.7 billion, up 221% annually and 54% from Q2, beating the company’s $16.0 billion guidance.
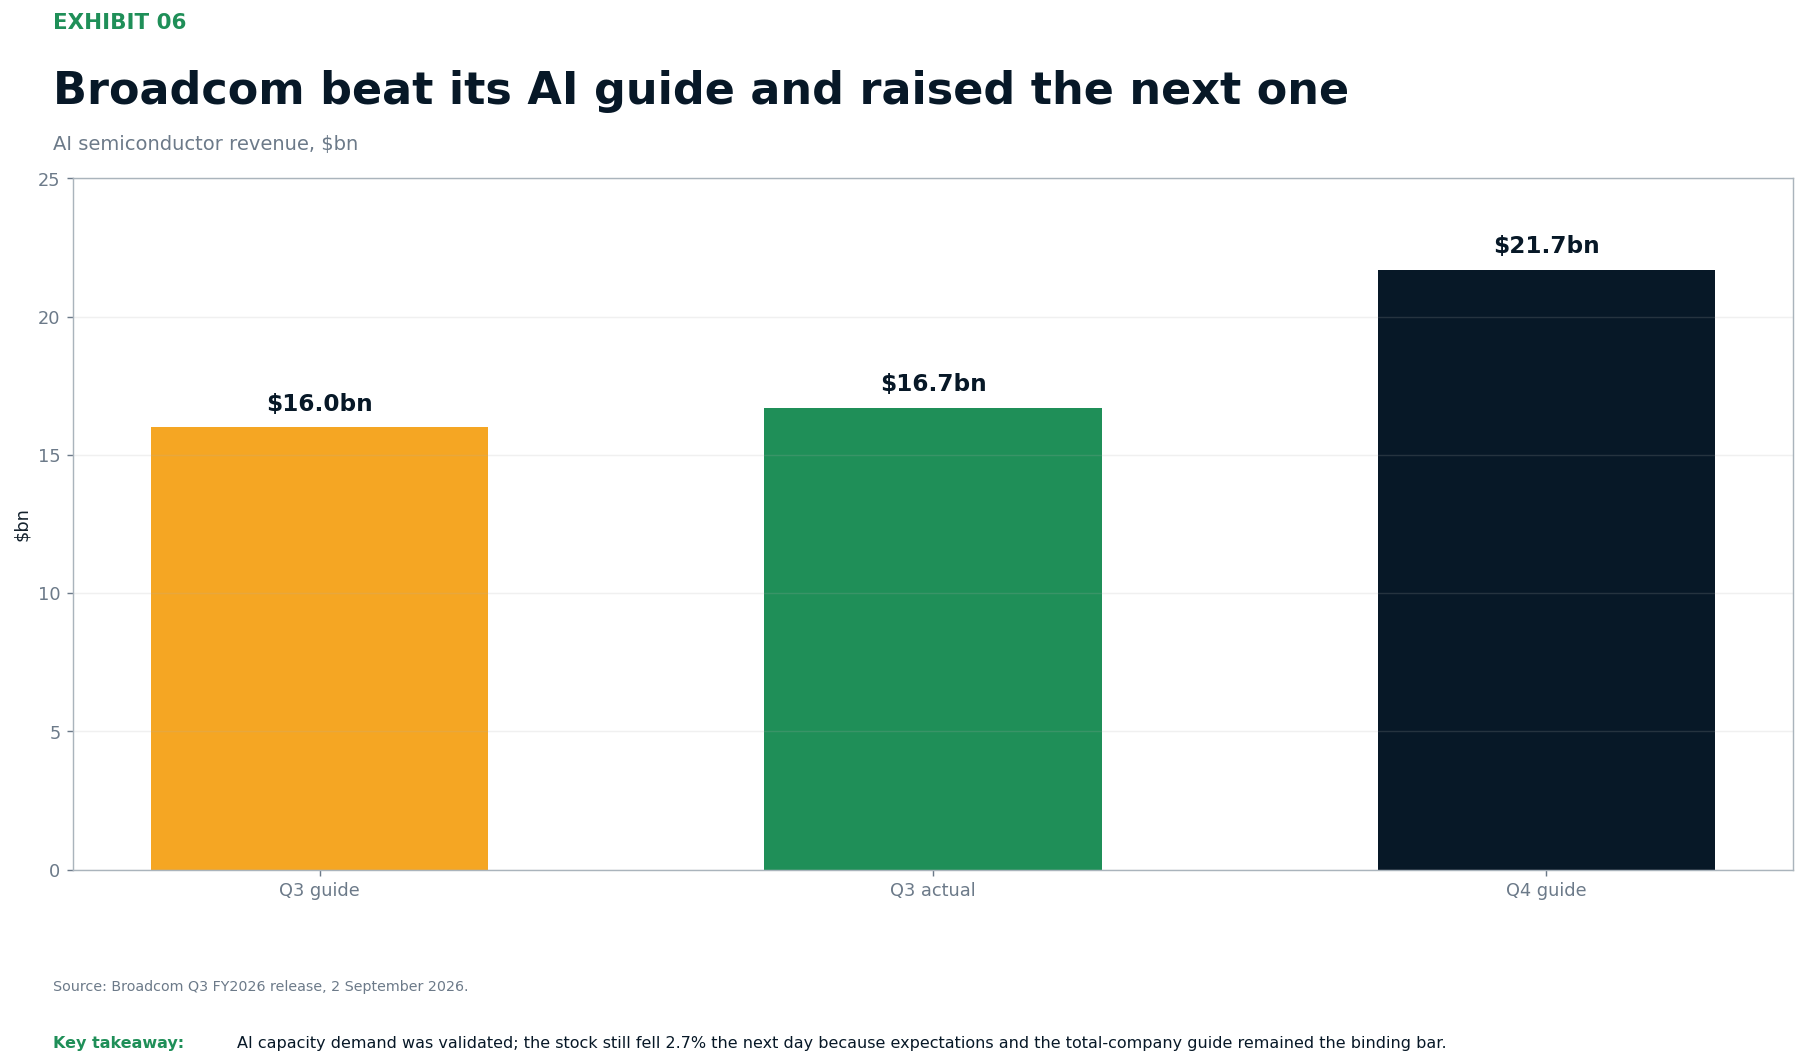
Figure 5. Broadcom raised the AI revenue bar again
Key takeaway: AI revenue exceeded guidance, but the company’s overall outlook fell short of market expectations.
Broadcom forecast Q4 AI semiconductor revenue of $21.7 billion, up 236% year on year. Reuters also reported management’s expectation of about $115 billion in fiscal-2027 AI-chip revenue, up from more than $100 billion, and roughly $230 billion in 2028. These remain forecasts. Q3 free cash flow was $13.7 billion, or 46% of revenue.
Shares fell 2.7% on Thursday. Total Q4 revenue guidance of about $34.8 billion was below the $35.03 billion analyst estimate cited by Reuters, despite the strong AI outlook. That supports the view that expectations were demanding. The share-price reaction alone, however, cannot tell us how much reflected valuation, competition or concerns about future execution.
What this does to last week’s AI thesis
The results reinforce the case for strong AI infrastructure demand, but do not establish what investors are willing to pay for it. Broadcom offered accelerating sales and still underperformed on the day. For us, the useful lesson is that AI growth must be assessed against expectations for the whole business, including margins, competition and delivery risk.
The same applies across semiconductors. Revenue can grow rapidly while shares struggle if forecasts already assume that growth, margins disappoint or other divisions weaken. An attractive long-term earnings outlook does not, by itself, establish an attractive near-term entry price.
What would prove capacity leadership is back: sustained outperformance by Broadcom and semiconductors, alongside rising revenue forecasts, would support a recovery. Continued underperformance would leave valuation and execution concerns unresolved.