


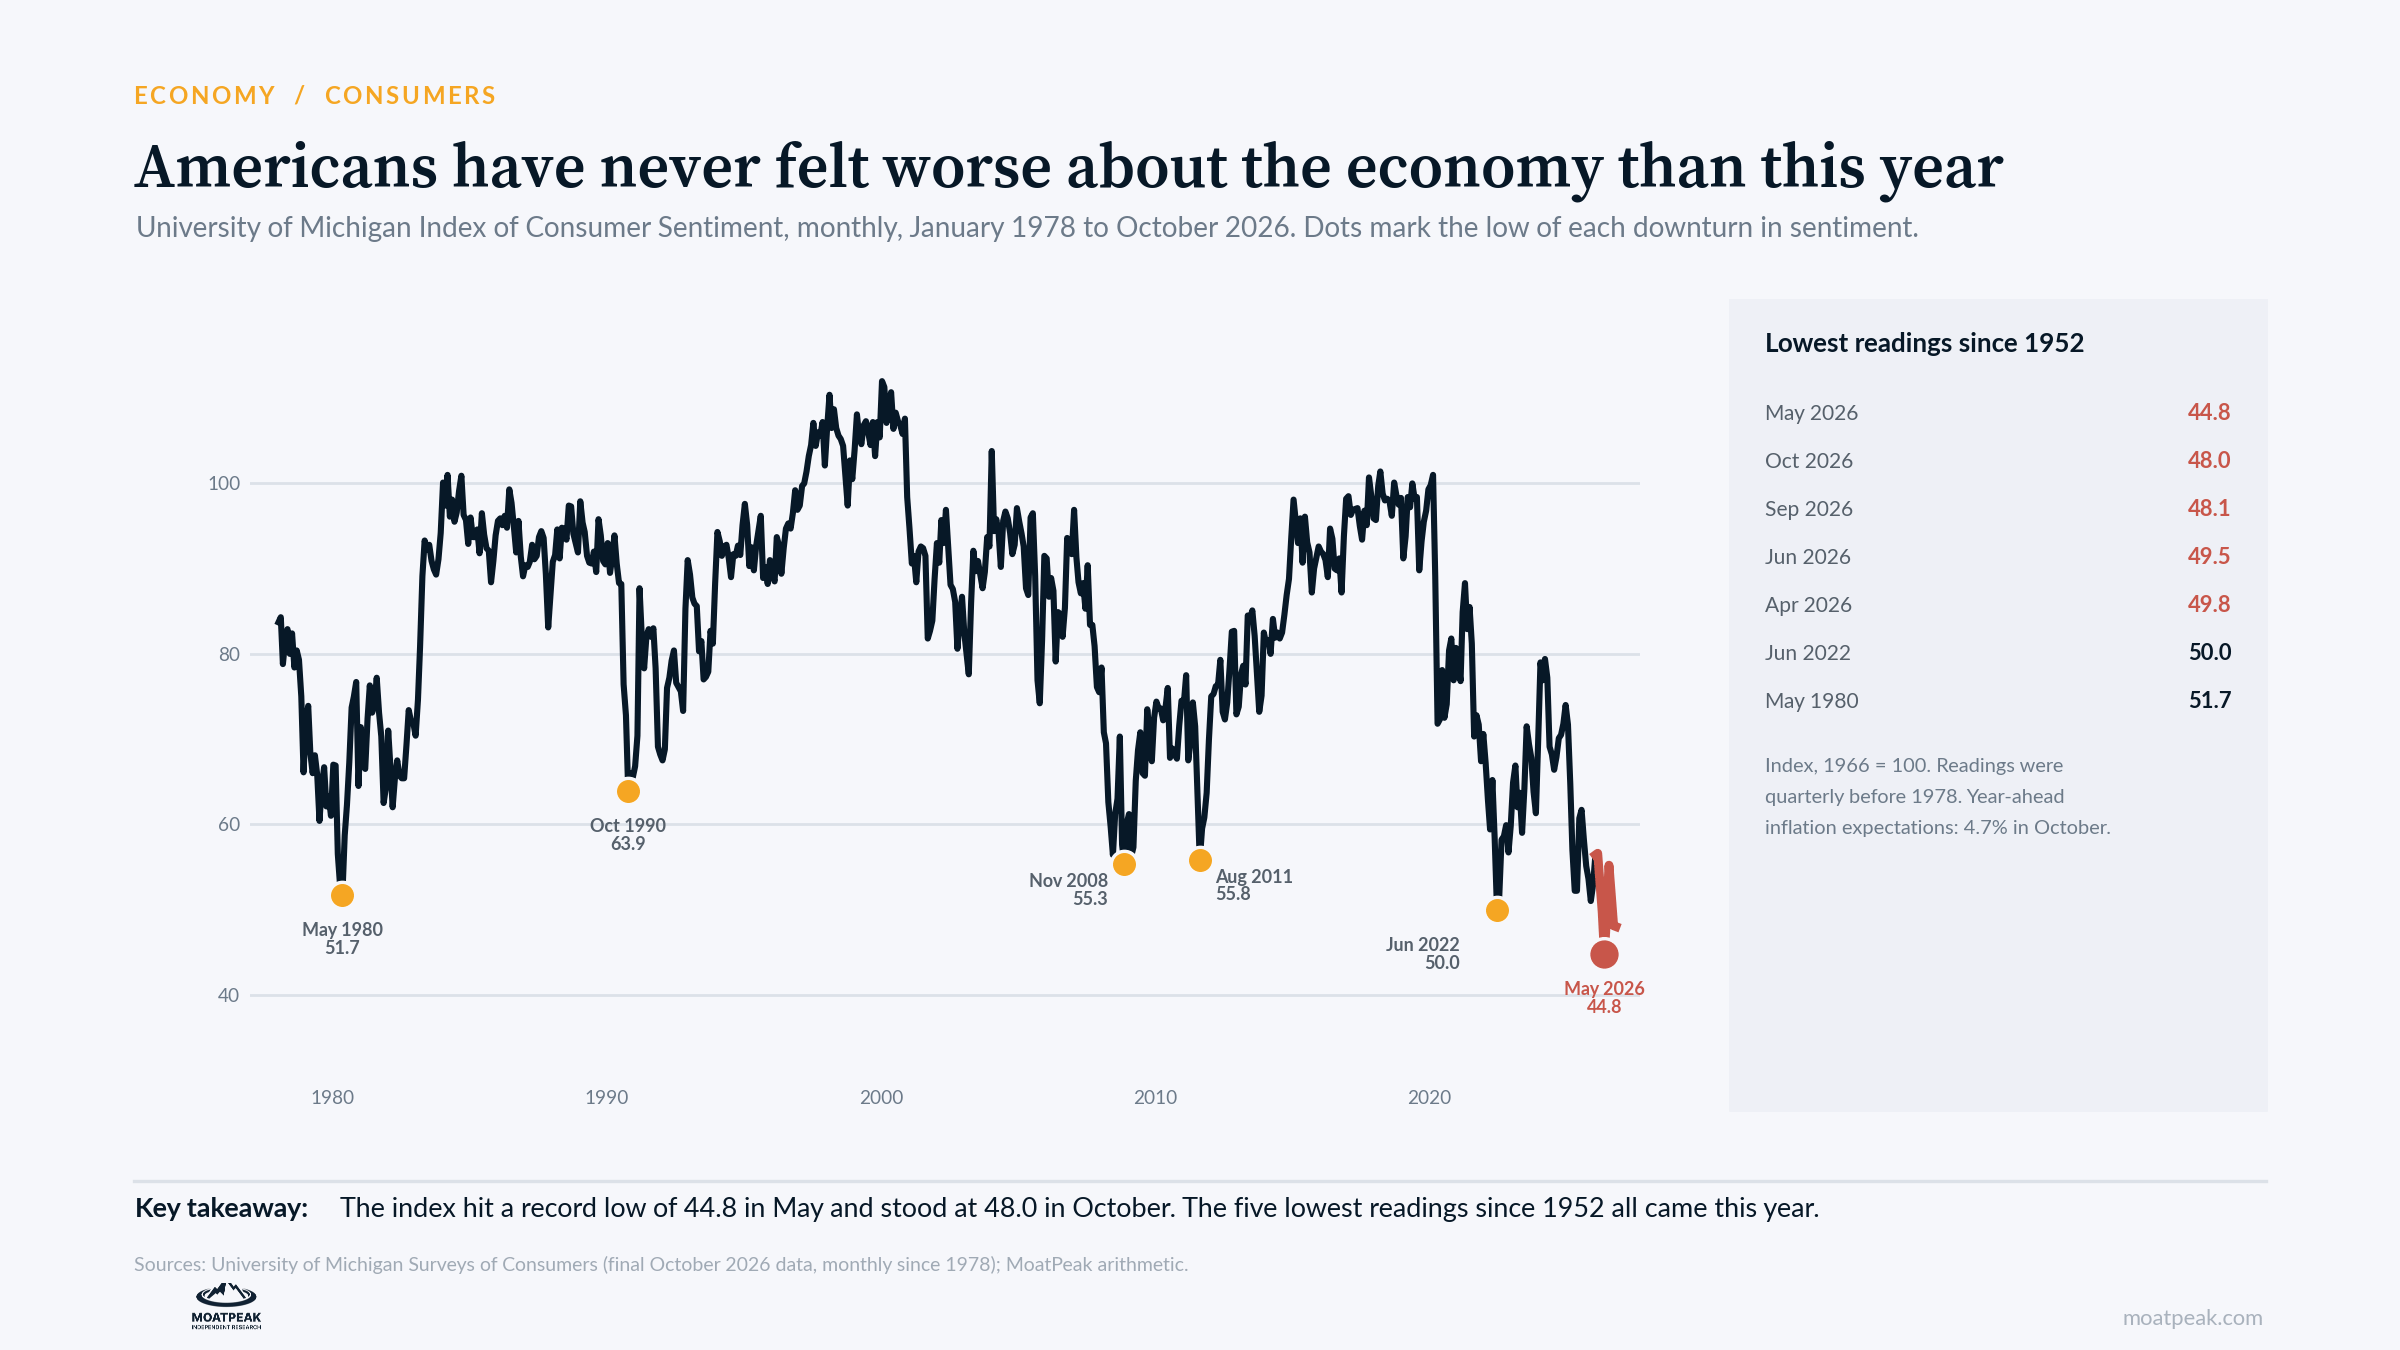
The University of Michigan’s index of consumer sentiment finished October at 48.0, the second-lowest reading since the survey began in 1952. The lowest was 44.8 in May. The five weakest readings on record all came this year.
The gloom is mostly about prices. “Purchasing power continues to dominate consumer views of the economy,” the survey’s director said on Friday. Year-ahead inflation expectations rose to 4.7 percent in October, up from 3.4 percent in February, just before the Iran conflict began. Buying conditions for big-ticket items fell 18 percent in a month because of higher interest rates and worries about affordability.
Businesses see a different economy. S&P Global’s flash survey of purchasing managers, also out on Friday, shows manufacturing at a 53-month high. Factories are hiring at the fastest pace since March 2012. Companies are also raising selling prices at the fastest rate since August 2022, as strong demand lets them pass on higher costs.
Gloom has usually been a buy signal
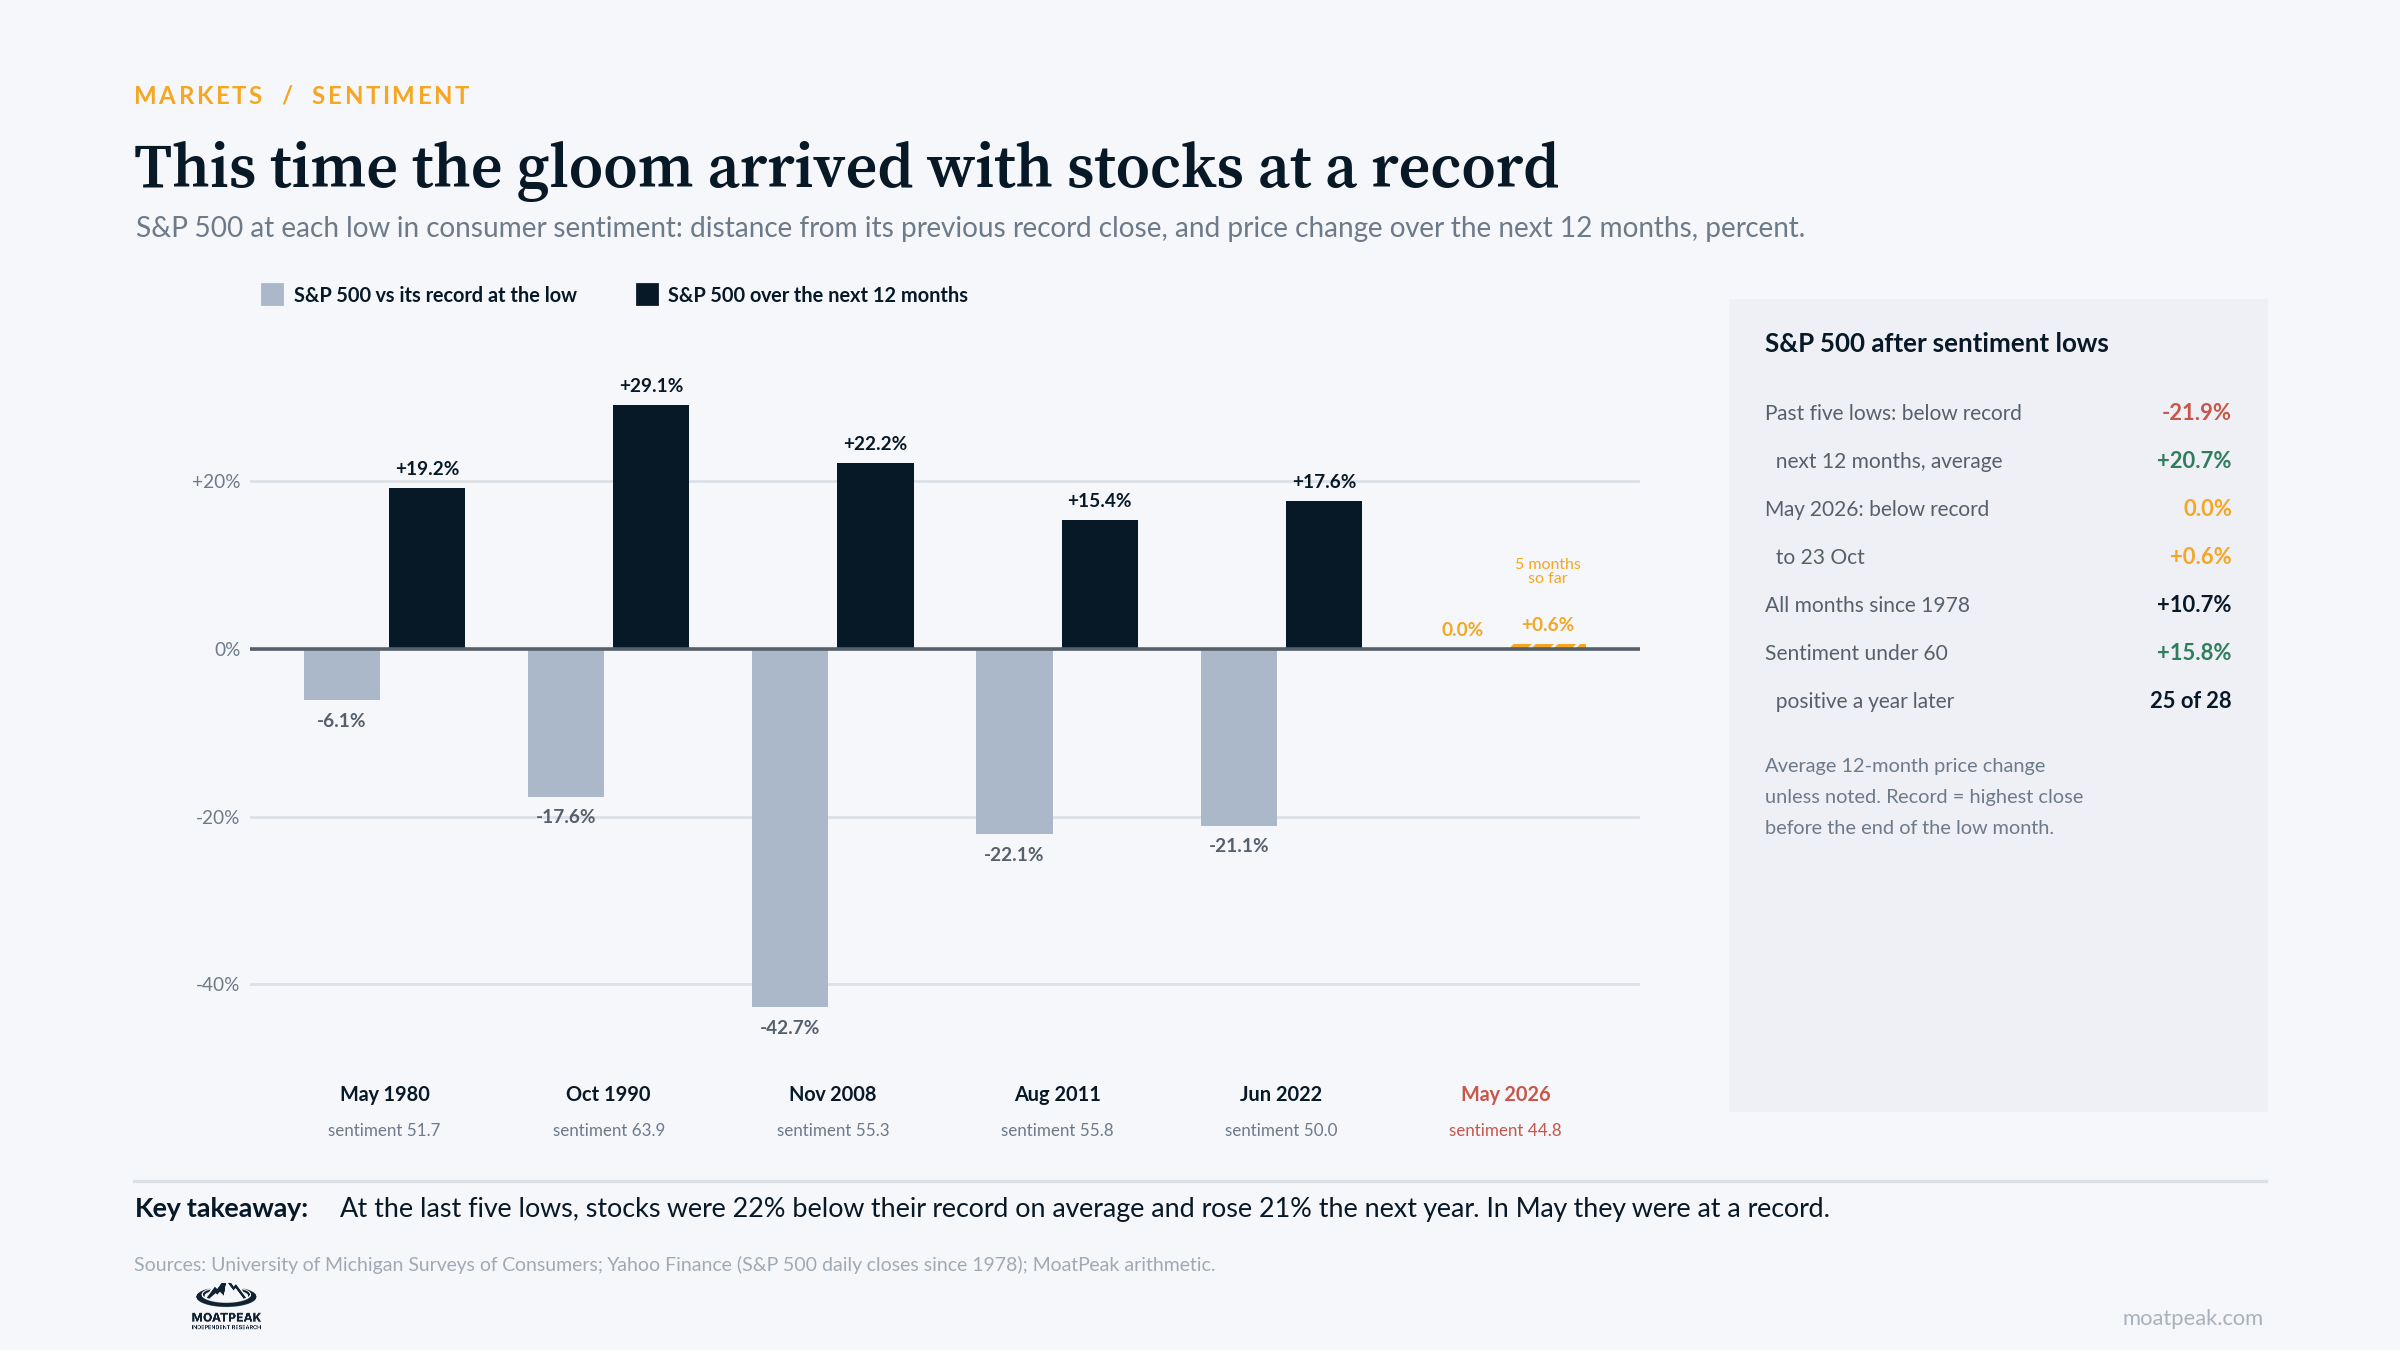
Investors have long treated deep consumer gloom as a contrarian signal, and history supports that view. Since 1978, in months when sentiment was below 60, the S&P 500 was higher a year later in 25 of 28 cases. The median gain was 17 percent, compared with 12 percent for all months.
The pattern is even clearer at the big lows. After each major low in sentiment, in 1980, 1990, 2008, 2011 and 2022, the S&P 500 rose 15 to 29 percent over the next 12 months.
There is a reason for that. At each of those lows, stocks were already below their record, usually far below. The S&P 500 was 6 percent below its record in May 1980, 18 percent below in October 1990, 43 percent below in November 2008, 22 percent below in August 2011 and 21 percent below in June 2022. By the time the survey hit bottom, the fear was already in the price.
Our read: this time the fear is not in the price
This year broke the pattern. Sentiment hit its record low in May, but the S&P 500 closed at a record on 29 May. Five months later, the index is up just 0.6 percent. On Friday, it stood 2.5 percent below its 6 October record.
That changes how we read the signal. In the past, a deep low in sentiment came when households and markets were scared together, so stocks had already been marked down when the survey bottomed. In 2026, the fear sits in household budgets, while the stock market is priced for strong profits. Households feel poorer because fuel, food and borrowing costs are higher. Shareholders feel richer because of AI spending and strong corporate margins.
So we do not see this low as a buy signal. The contrarian trade works when prices have already absorbed the bad news. This time, they have not.
The case against us
The survey may overstate the gloom. The University of Michigan now runs the survey online, and its own researchers have studied how that shift and partisanship affect the readings. And businesses report strong demand: in S&P Global’s survey, new orders grew at the fastest pace in more than four and a half years.
Sentiment is also a weak timing tool, and our sample of big lows is small. In 1980, stocks were only 6 percent below their record when sentiment bottomed, but they still rose 19 percent over the next year.
What it means for your money
Don’t buy just because people feel bad. Gloom has been a good signal when stocks were already down. The S&P 500 is near a record high.
Keep an eye on inflation expectations. At 4.7 percent for the year ahead, they limit how much the Fed can cut rates if growth slows.
Watch pricing power. If companies keep raising prices faster than wages rise, household gloom could turn into weaker spending.
What we are watching
Wednesday 28 October: the Fed’s rate decision, and whether it mentions inflation expectations.
Friday 6 November: preliminary November sentiment and the October jobs report.
Tuesday 10 November: October consumer prices.
Educational research only. Not personalized investment advice. MB “MoatPeak Group”.