


Americans vote on Tuesday, 3 November. Few patterns in market history are as consistent as what has followed midterm elections.
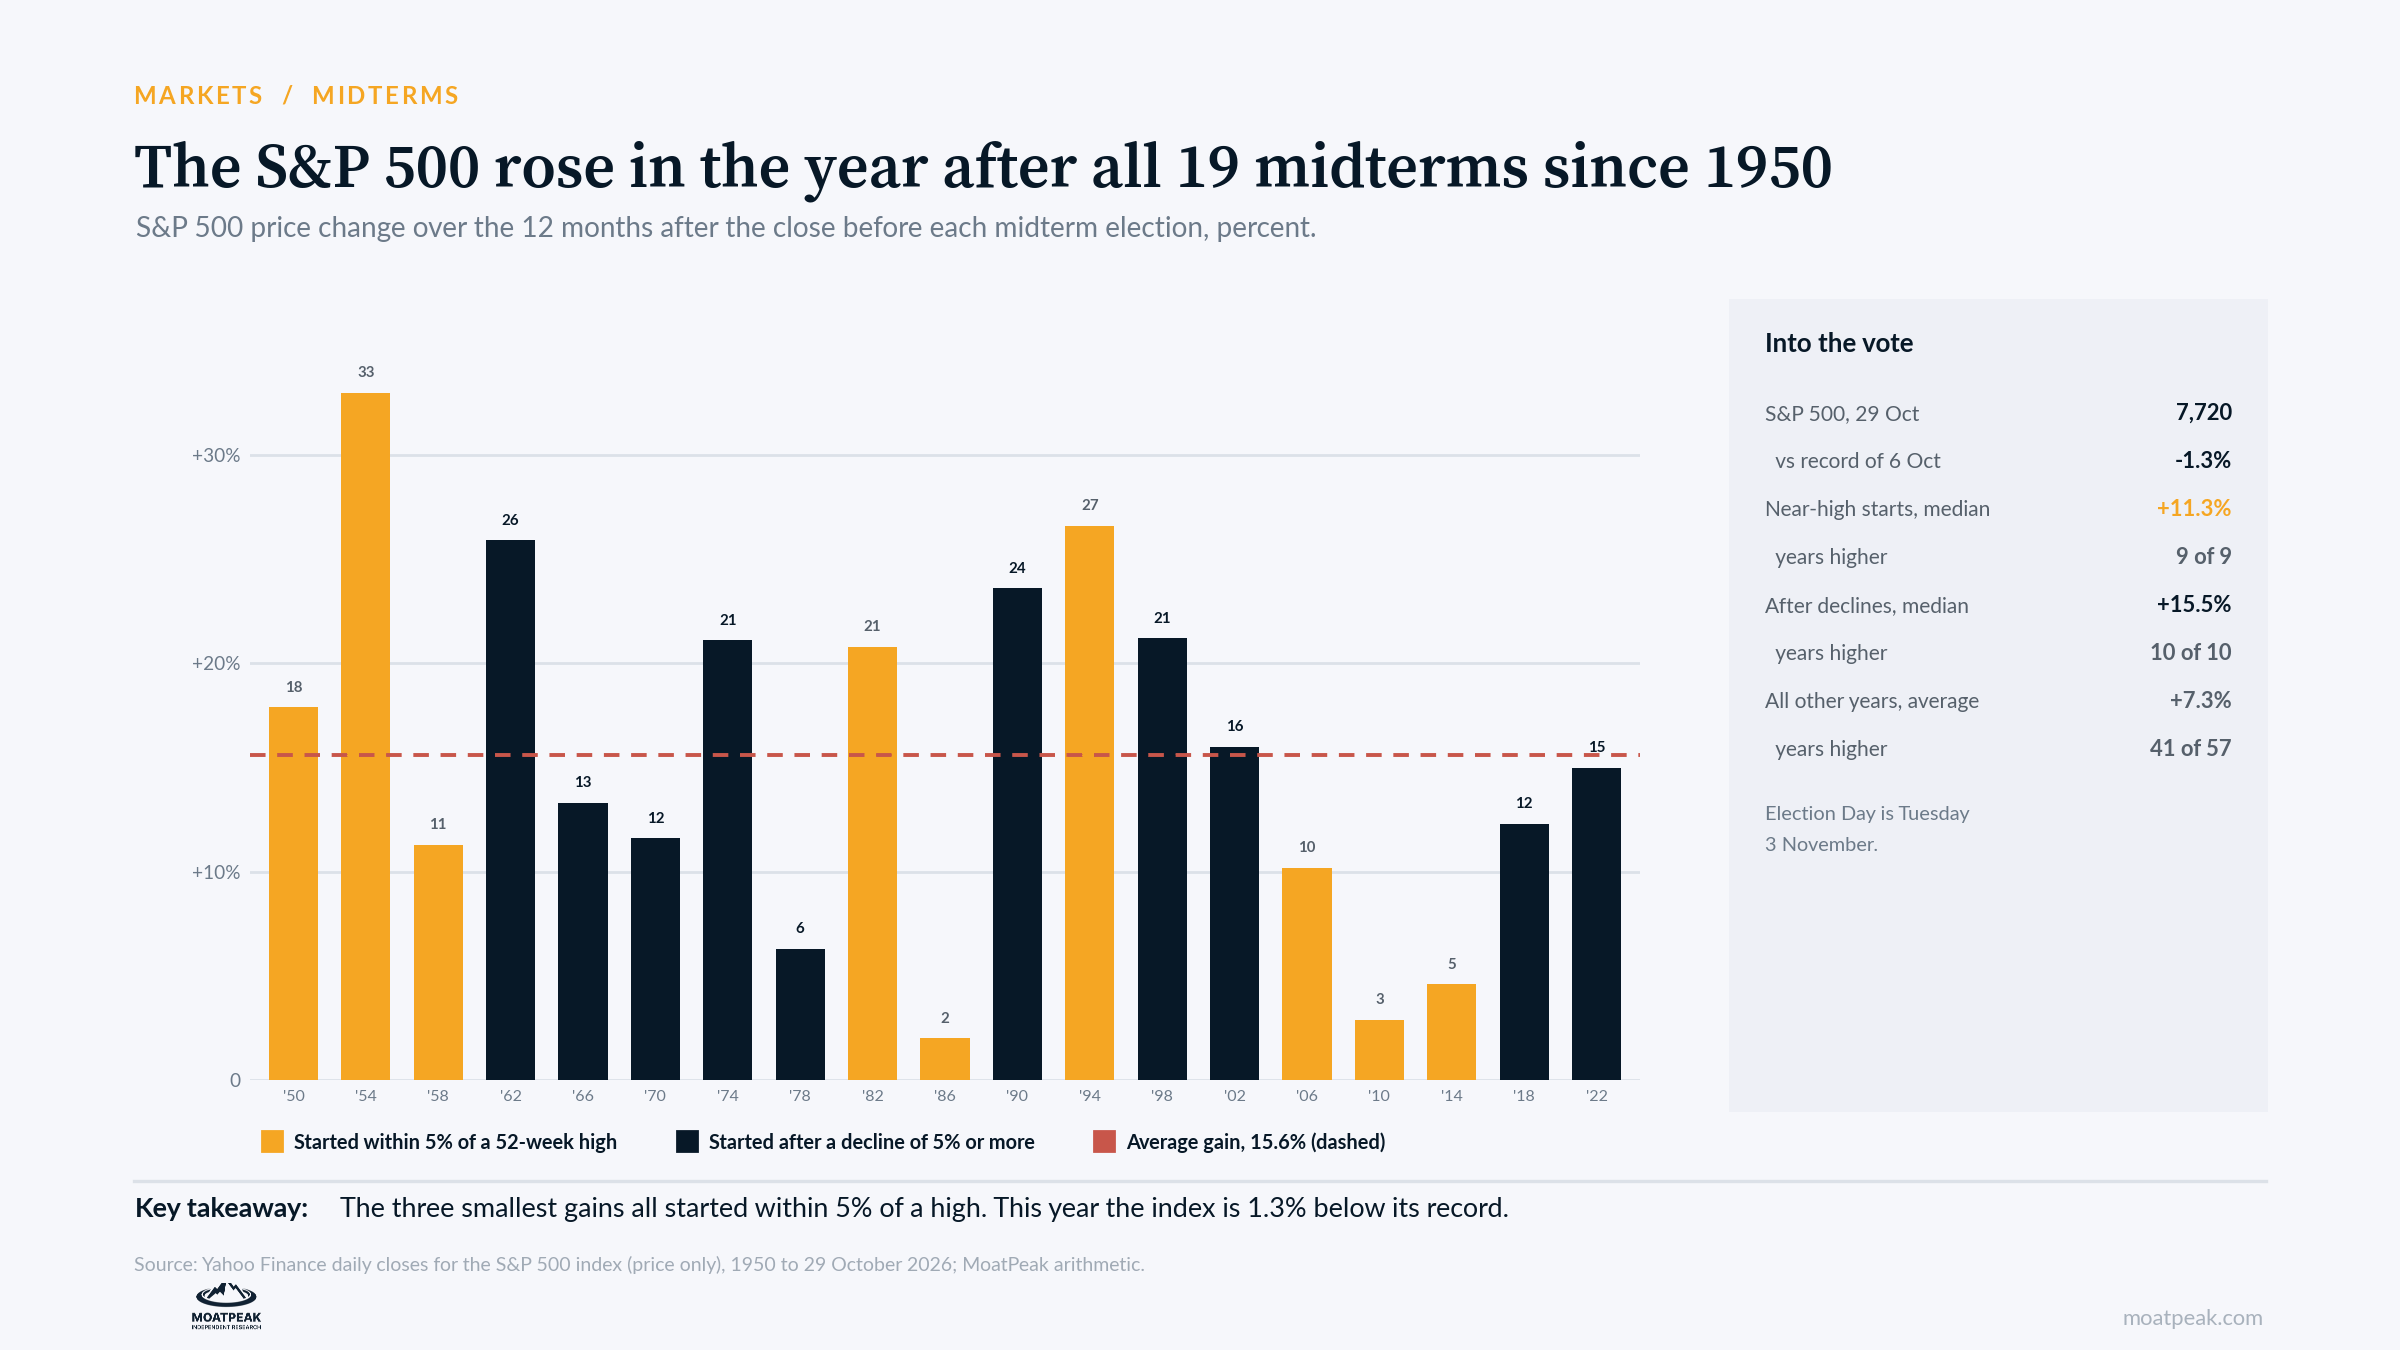
We measured the S&P 500 from the close before each midterm since 1950. Twelve months later, the index was higher every time, 19 out of 19. The average gain was 15.6 percent and the median 15.0 percent. Measured from the same November date in the other 57 years, the average was 7.3 percent, and the index rose in 41 of them.
The strongest year of the cycle
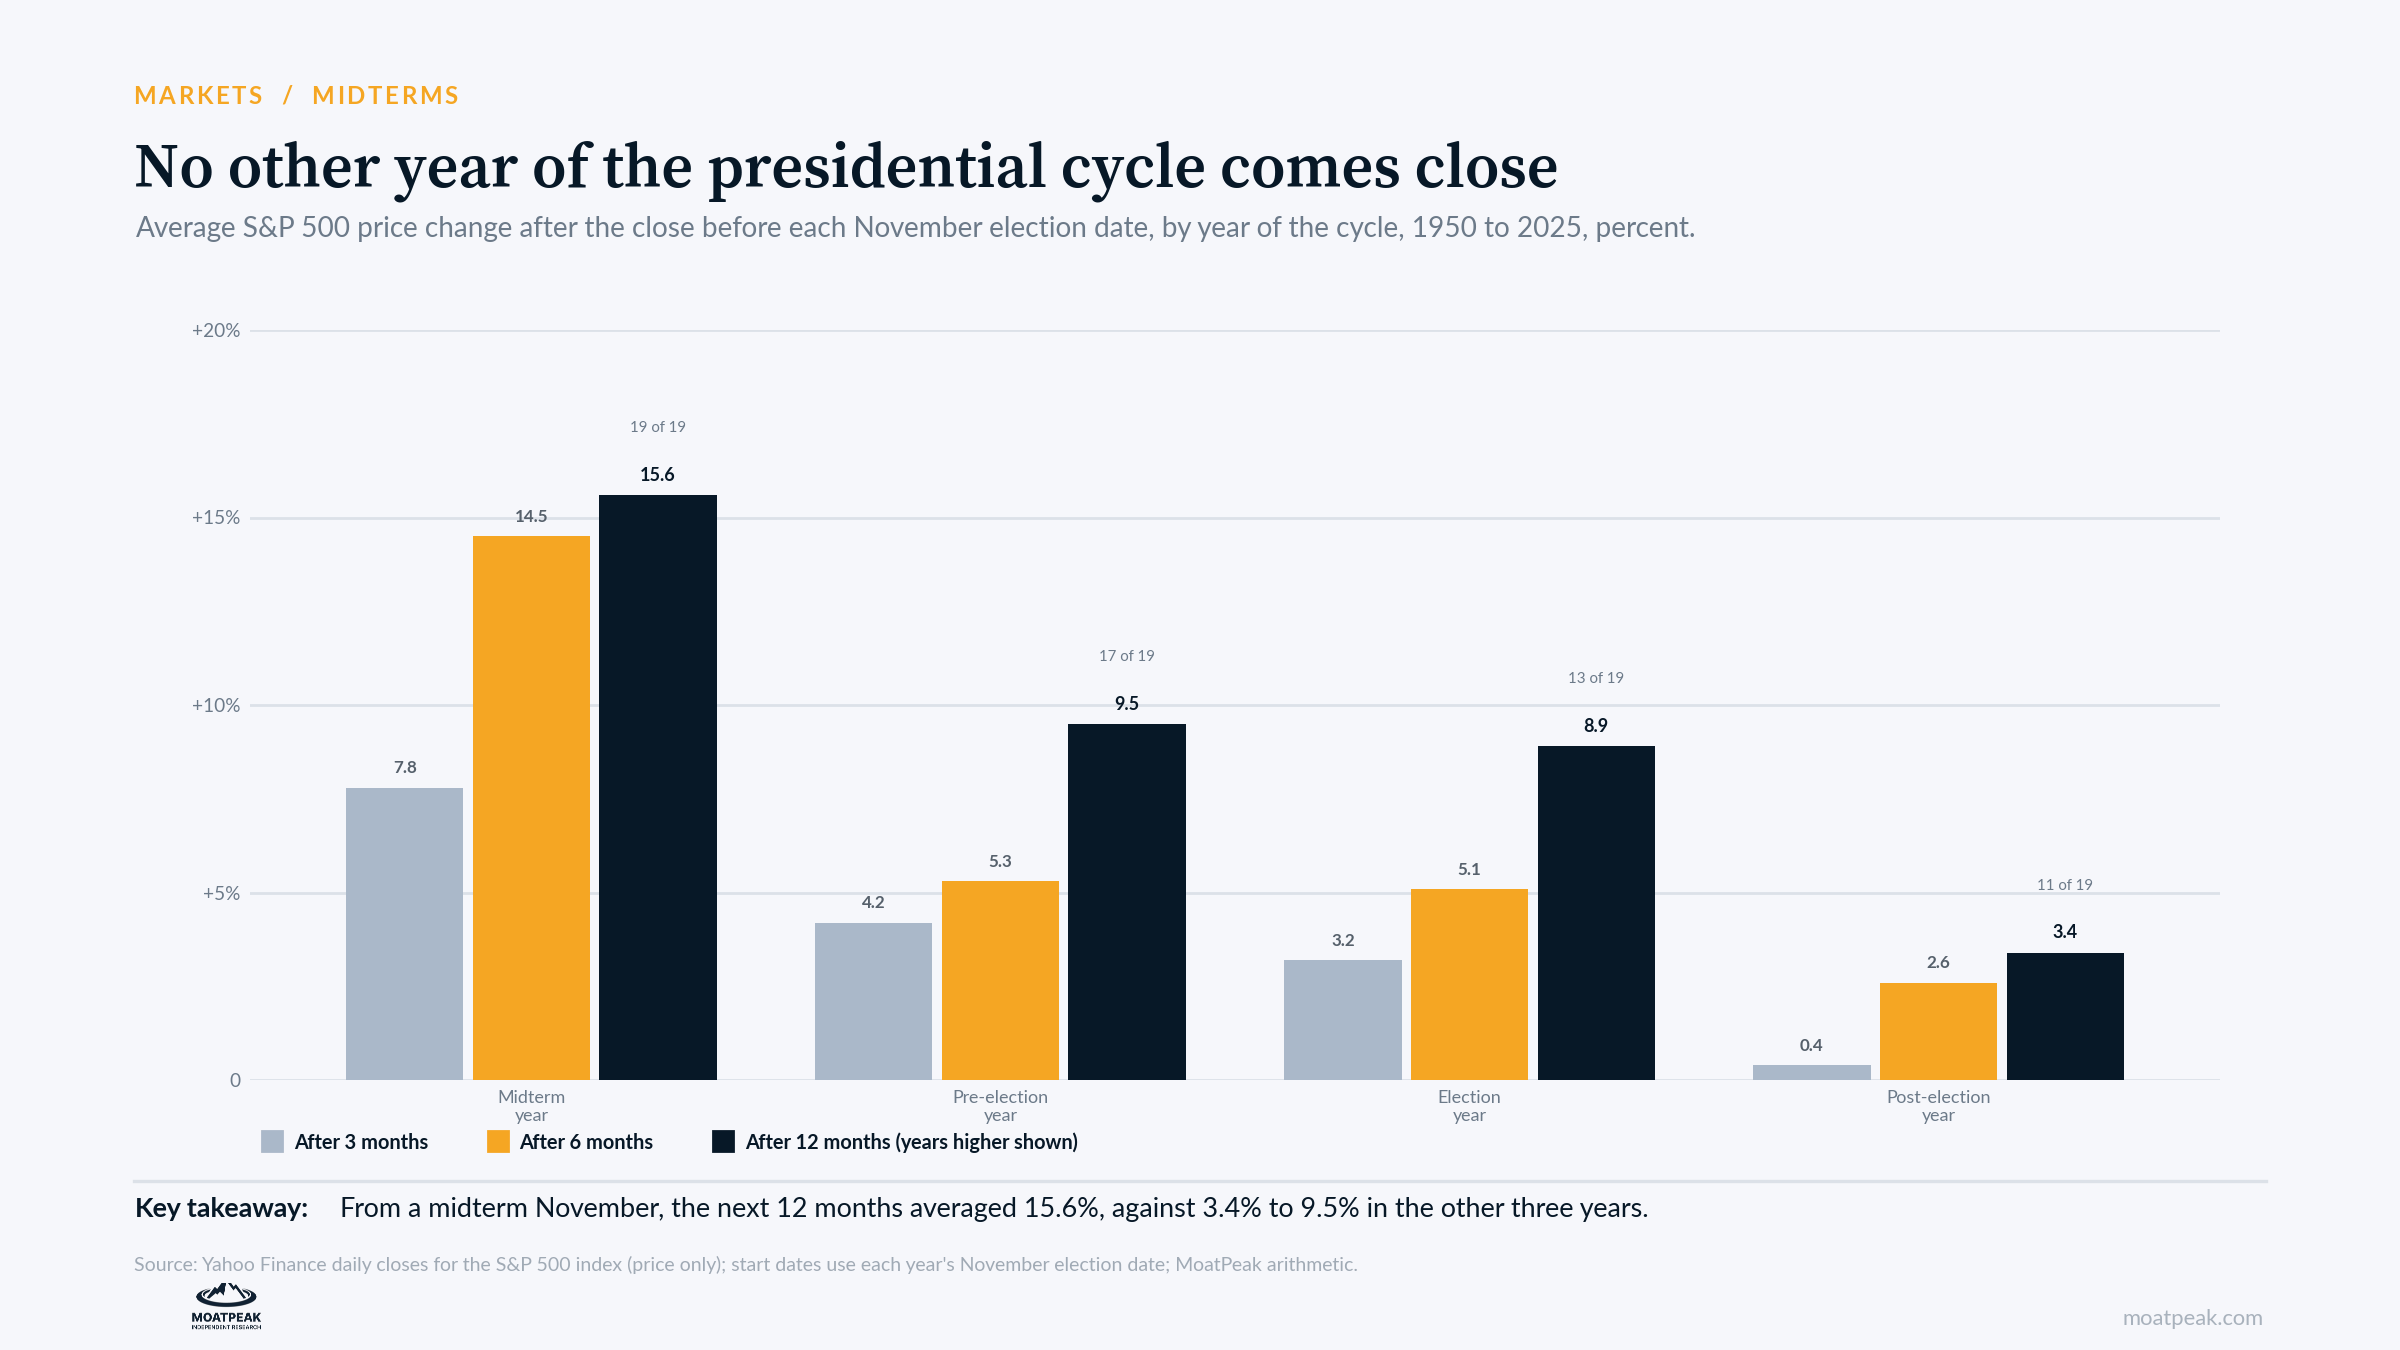
The pattern shows up across the four-year presidential cycle. From a midterm November, the S&P 500 gained an average of 7.8 percent over the next three months, 14.5 percent over six and 15.6 percent over twelve. It rose over six months in all 19 cases.
No other year comes close. From the November of a pre-election year, the next 12 months averaged 9.5 percent. After a presidential election, they averaged 8.9 percent, and in the year after that, 3.4 percent.
Where this year starts
The usual explanation is that midterm years are weak, so the rally starts from a low. On average, the S&P 500 fell 17 percent from a peak at some point in the midterm year before the vote. Part of what followed was a recovery from that slump.
This year looks different. The index closed at 7,720 on 29 October, 1.3 percent below its record of 6 October and up 12.8 percent for the year. Its deepest decline in 2026 was 9.1 percent, and it has long since recovered.
History has a category for that. Nine midterms began with the index within 5 percent of its 52-week high. The S&P 500 rose after all nine, but the median gain was 11.3 percent, against 15.5 percent for the 10 that began after a decline of 5 percent or more. The three smallest gains of all came from near-high starts: 2.0 percent after 1986, 2.9 percent after 2010 and 4.6 percent after 2014.
Our read
Nineteen out of 19 is a record worth respecting, and we would not bet against it. We would treat it as a base rate, one input among several.
The base rate says the next 12 months tend to be good after a midterm and somewhat less good when the market starts near a high. It cannot know what is different this time. The largest companies in the index are now borrowing to fund their capital spending, and inflation is running at 3.6 percent with two Fed officials voting for a hike in October. Neither shows up in an average of 19 elections.
The case against us
The near-high group still rose every time, and its median gain of 11.3 percent beat the average for non-midterm years. Starting near a record has not been a reason to sell.
The samples are small. Nineteen elections split into two groups of nine and 10 leave a lot of room for chance, and one or two outcomes could change the medians.
The pattern may rest on politics more than on prices. If gridlock after a midterm is what calms markets, the starting level matters less than we suggest.
What it means for your money
Don’t trade the week. From the vote to the end of the year, midterm years averaged a 2.9 percent gain, about the same as the 2.7 percent average for all years. The edge has shown up over the following months.
Stay invested, but rebalance. Long-term investors have rarely been hurt by holding through a midterm. If stocks have grown into a larger share of your portfolio, trimming back to your target needs no forecast.
Expect less from a high start. The record says gains are likely. It also says they have been smaller from where the market stands today.
What we are watching
Tuesday 3 November: the vote, and how quickly control of each chamber is called.
Wednesday 4 November: the Treasury’s quarterly refunding announcement.
The months after: whether this cycle follows the pattern from a near-record start.
Educational research only. Not personalized investment advice. MB “MoatPeak Group”.
Nineteen out of 19 is hard to argue with, but your gridlock point is the one that decides how much of it applies this time. If the mechanism is political calm rather than cheap prices, then how quickly control of each chamber gets called tomorrow matters more than the 1.3% gap to the record. The 2.9% average gain from vote to year-end is a useful anchor against anyone tempted to trade the week. One question: in the nine near-high cases, did the gains cluster in the first few weeks after the result was clear, or did they need the full year? That would tell us whether the pattern is about relief or about the policy that follows.