


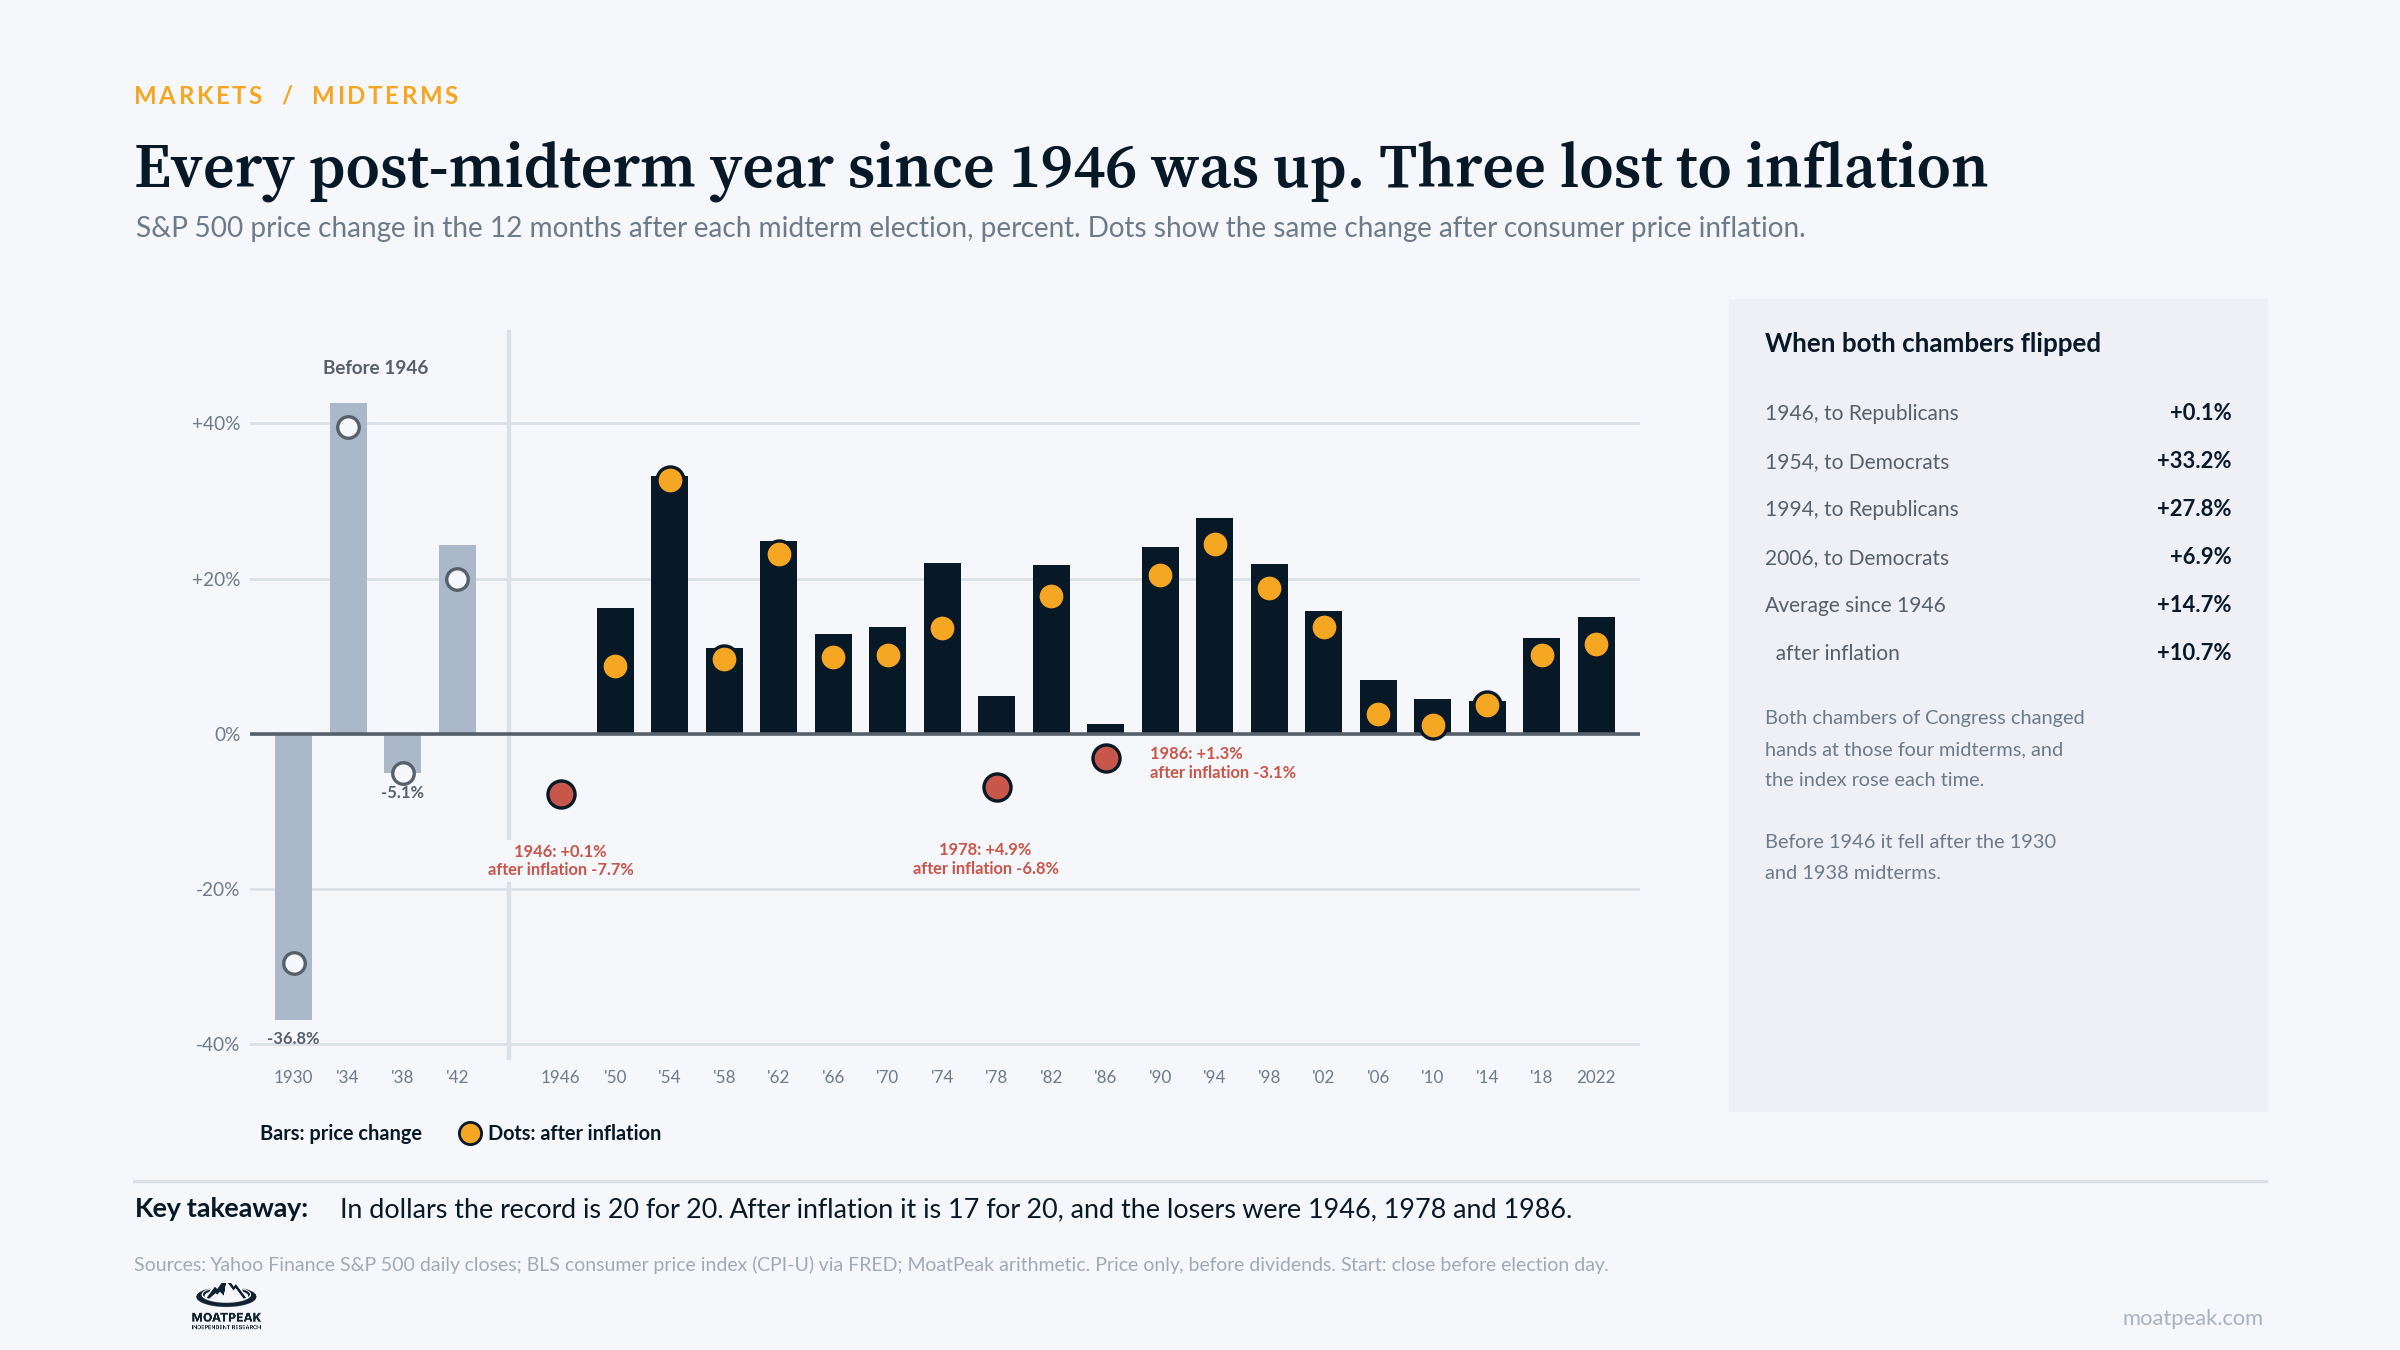
Since 1946, the S&P 500 has been higher 12 months after every midterm election: 20 times out of 20. The average gain was 14.7 percent, about double the 7.6 percent average for the same 12-month window in other years. With the vote on 3 November, the question we hear most is whether a Democratic sweep could break that run. Polymarket puts the odds of Democrats winning both the House and the Senate at about 60 percent.
Our reading of the record is that the party result has mattered less than inflation. Adjusted for consumer prices, three of the 20 post-midterm years lost money: 1946, 1978 and 1986. The two worst came with the highest inflation of the 20, at 8.5 percent and 12.6 percent over the 12 months after the vote.
What a sweep has meant before
Both chambers of Congress have changed hands at four midterms since 1946: in 1946 and 1994 to Republicans, and in 1954 and 2006 to Democrats. Each time, the president’s party lost control, and each time the S&P 500 was higher a year later: by 0.1 percent after 1946, 33.2 percent after 1954, 27.8 percent after 1994 and 6.9 percent after 2006.
That fits the usual explanation for the midterm pattern. Uncertainty about who controls Congress fades after the vote, and a divided government tends to pass fewer big laws. A Democratic Congress facing a Republican president would be a divided government. Four cases prove little, but they give no sign that an opposition sweep is bad news for the index.
Where the pattern has been weak
The record also starts at a convenient point. The index fell 36.8 percent in the year after the 1930 midterm and 5.1 percent after 1938.
Since 1946, the split that matters is inflation. In the six years when consumer prices rose more than 4 percent in the 12 months after the vote, the S&P 500’s average gain after inflation was 1.2 percent. In the other 14 years, it was 14.8 percent. Even before adjusting for prices, the averages were 8.6 percent and 17.4 percent.
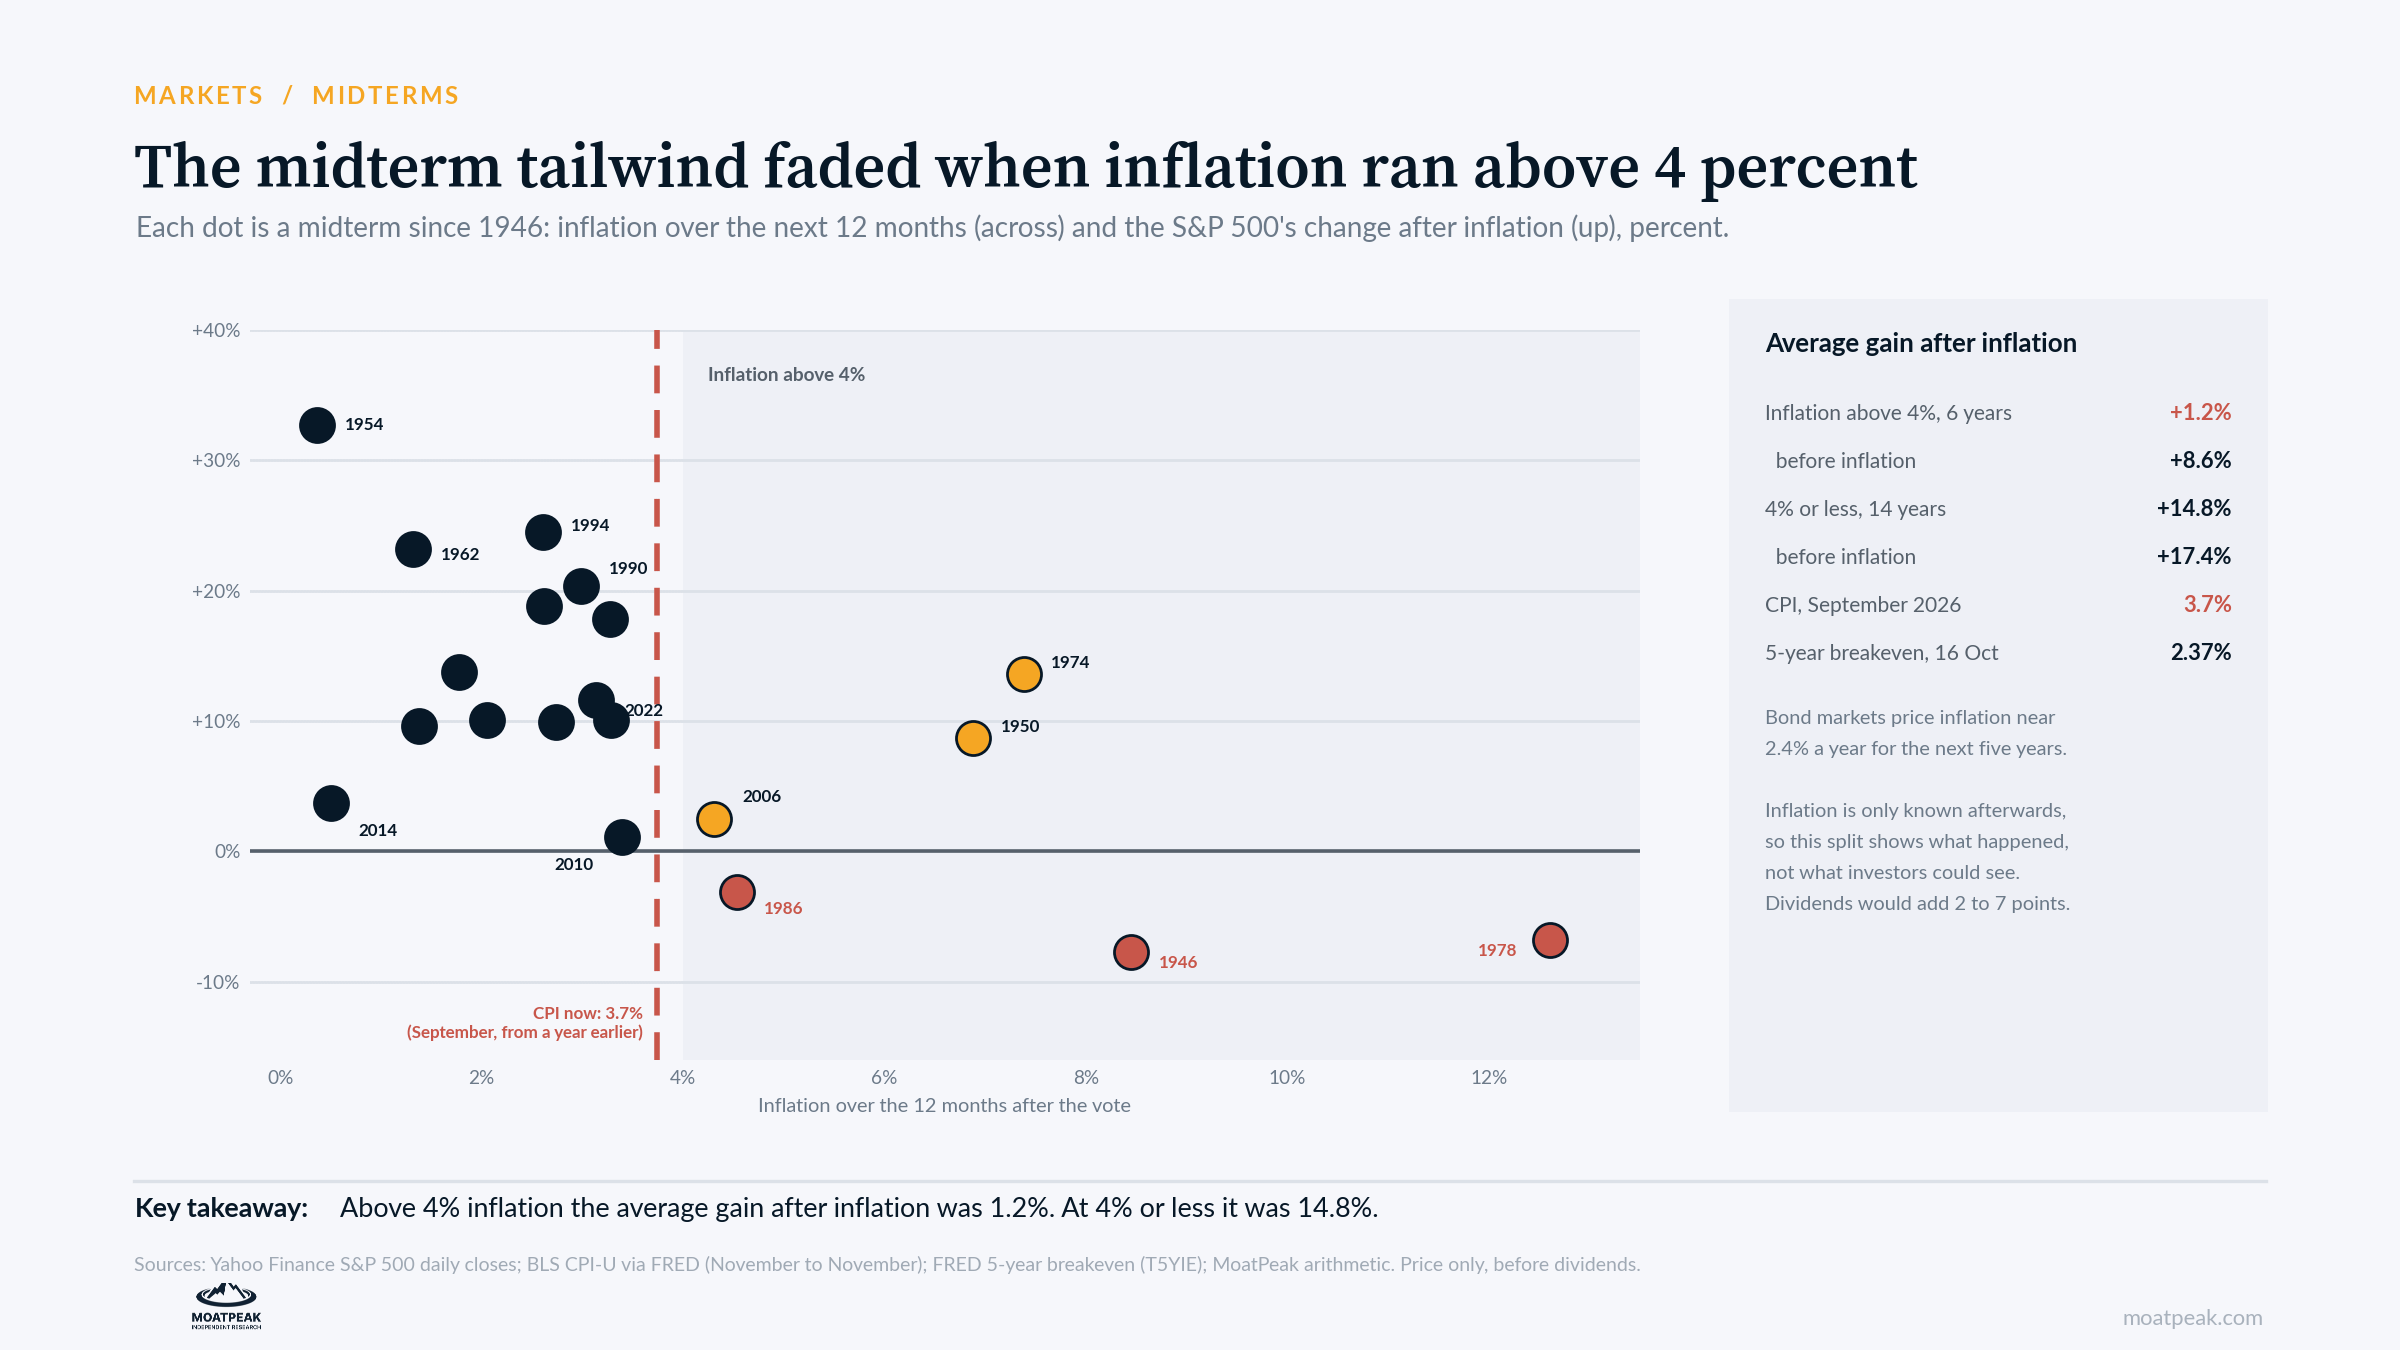
The three real losses show how this works. In 1946, the index rose 0.1 percent while prices jumped 8.5 percent after wartime price controls ended. In 1978, a 4.9 percent gain met 12.6 percent inflation. In 1986, prices rose 4.5 percent, and the October 1987 crash wiped out most of the year’s gains.
This matters now because inflation is rising again. Consumer prices rose 3.7 percent in the year to September, up from 2.4 percent in January. The Fed raised its rate on 16 September, and the 10-year Treasury yield is near 5.1 percent. Dividends also offer less cushion than they used to: the S&P 500 yields about 1.1 percent, against 4.7 percent in 1946 and 5.0 percent in 1978.
The case against us
Bond markets do not share our worry. The 5-year breakeven rate, the inflation that investors build into Treasury prices, was 2.37 percent on 16 October, well below 4 percent. If they are right, the midterm tailwind should work as it usually has.
High inflation has not always hurt, either. In 1974, prices rose 7.4 percent in the year after the vote, and the index still gained 13.6 percent after inflation, helped by a deep starting point: it had fallen 37.6 percent from its high for the year by early October. And inflation is only known afterward. Our split uses the inflation that actually followed each vote, which investors could only guess at on election night.
A strong year so far has not been a problem in itself. The S&P 500 is up 11.9 percent in 2026 and 2.0 percent below its 6 October record. In the seven midterm years when the index went into the vote up more than 10 percent, it gained 16 percent on average over the next 12 months.
What it means for your money
Treat the 20-for-20 record as a dollar figure. After inflation, it is 17 for 20, and the misses came when prices rose fast.
Watch inflation more than the polls. The October consumer price report on 10 November may say more about the year after the vote than the result on 3 November.
Expect bumps even in good years. In the year after the 1986 midterm, the index fell 33 percent from its high before ending slightly up.
What we are watching
27 and 28 October: the Fed’s rate decision, the last before the vote.
3 November: the midterm elections. Close Senate races could take days to call.
10 November: the October consumer price index.
Educational research only. Not personalized investment advice. MB “MoatPeak Group”.