


Let’s begin with the disagreement, since it is unusually clear.
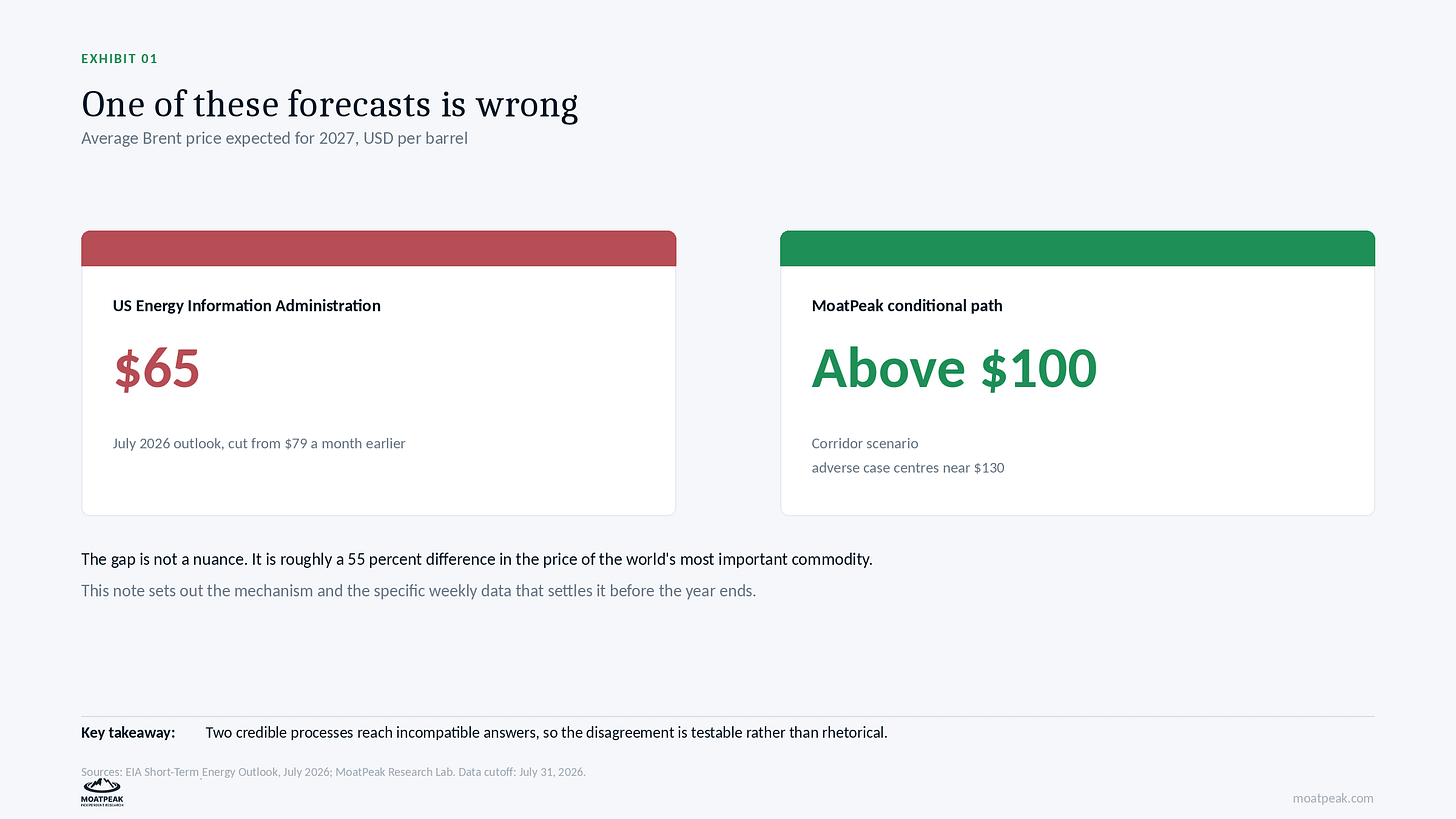
The US Energy Information Administration expects Brent crude to average 65 dollars in 2027. It cut that forecast from 79 dollars only last month, so the official view has become more relaxed since the Hormuz crisis, not less.
Our scenario points to a price above $100.
One of these forecasts is wrong, and there is no middle ground. Instead of debating, we will show you the process and the numbers that will settle this before the year ends.
The constraint nobody is doing the arithmetic on
Today’s oil price is not a natural one. It shows a market supported by emergency barrels.
Governments are releasing about two million barrels a day from strategic reserves. That borrowed supply is covering a production shortfall so prices do not have to rise.
The real question is not today’s oil value, but what happens when that borrowed supply ends. This is a math problem, not just a forecast.
The U.S. reserve holds about 325.7 million barrels, its lowest since May 1983. In March, the Department of Energy approved an emergency release of 172 million barrels, and about 104 million have been used. That leaves around 68 million barrels still authorized on paper.
Now, here is what changes the situation.
The reserve is not simply a warehouse. The oil is stored in underground salt caverns, which have a physical minimum. If the level drops too low, the system cannot pump properly. Engineers estimate this minimum is between 250 and 300 million barrels.
If you subtract the remaining 68 million barrels from 325.7 million,
You end up with 243 million barrels. That is below the floor.
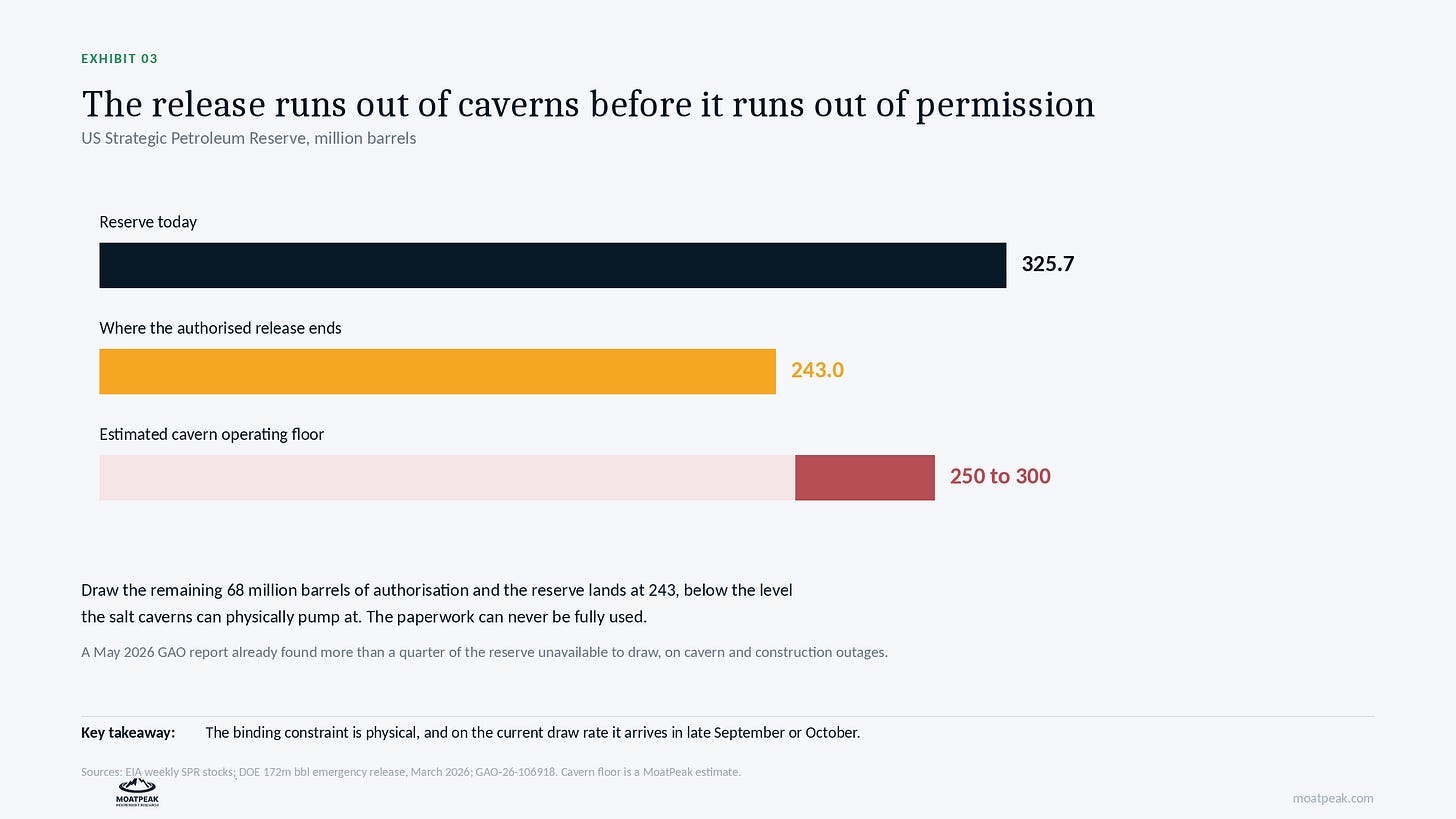
This means the full authorized amount cannot be used—not for political reasons, but because of the physical limits. The caverns will stop releasing oil before the paperwork is finished. At the current draw rate of four to five million barrels a week, the system starts to degrade in late September or October.
We were careful about this when we first wrote it, and flagged the cavern floor as an engineering estimate awaiting official documentation. Then we found the documentation. A Government Accountability Office report from May 2026 found that more than a quarter of the reserve’s inventory was unavailable to draw, on a combination of cavern and construction outages, with non-deployable inventory estimated at a minimum of 103 million barrels.
This constraint is real, physical, and already documented in an official audit.
The election on the same calendar
Add one more date to the timeline: the United States holds midterm elections on November 3.
Releasing reserve oil is an executive decision. The politically rational path is to stretch the buffer to exactly the day people vote.
To reach 250 million barrels by November 3, the draw needs to be 3.94 million barrels a week. The average for the last two weeks is 4.04 million barrels a week.
The current draw rate is already on track for the election.
This offers a clearer test than any opinion, and we prefer to give you a test instead of just our view. If weekly draws stay between 3.9 and 4.4 million through September, the plan is confirmed, and the buffer hits its minimum on Election Day. If draws drop toward one million, the administration is protecting the reserve and the risk has passed. If draws stay above five million, there is no plan and the authorized supply runs out by mid-October.
Watch the weekly Wednesday release. It determines the timeline, not the headlines.
Why cheap oil today is the thesis rather than the refutation
Here is the main objection to our argument, and it deserves a direct answer.
The physical market right now is soft. Barrels available for immediate delivery are trading below paper barrels months out, by about six dollars, against a crisis peak above plus thirty. Refiners have cut runs. The spring stockpiling has faded. That is the classic signature of abundance, not shortage.
All of that is true. In fact, it is exactly what our model expects.
A market getting two million extra barrels a day should look oversupplied. It would be odd if it did not. This softness does not disprove the shortfall; it is just how the shortfall looks while it is being hidden.
That is why we focus on one number instead of commentary. When physical barrels stop trading below paper ones, and the gap crosses zero, the masking ends and the shortfall shows up in the price.
A thesis claiming tight supply is already here would be easier to sell but harder to prove. Ours says the opposite and gives you a clear signal to watch for.
Three things reverse on the same day.
The most interesting thing about November 3 is not the election itself, but that three separate factors change at the same time.
The incentive to keep releasing dies with the election. Refill rhetoric becomes attractive, and there is already a stated buyback price of 67 to 73 dollars for WTI. And the releases were largely structured as swaps, meaning the oil was lent to companies who must return it with a premium. Those returns run from roughly November 2026 to September 2028 and total around 200 million barrels, about 0.29 million barrels a day of contractual demand pulled out of the commercial market.
So, the supply side shifts in three ways at once, starting the week the buffer reaches its minimum.
The inflation shape that is already decided
This is the part we trust most, because it does not need a forecast—just a calendar.
Annual inflation compares each month to the same month the year before. So, 2027’s inflation will be measured against 2026’s oil prices, which are already set. Those numbers are history and cannot be changed by anything that happens now.
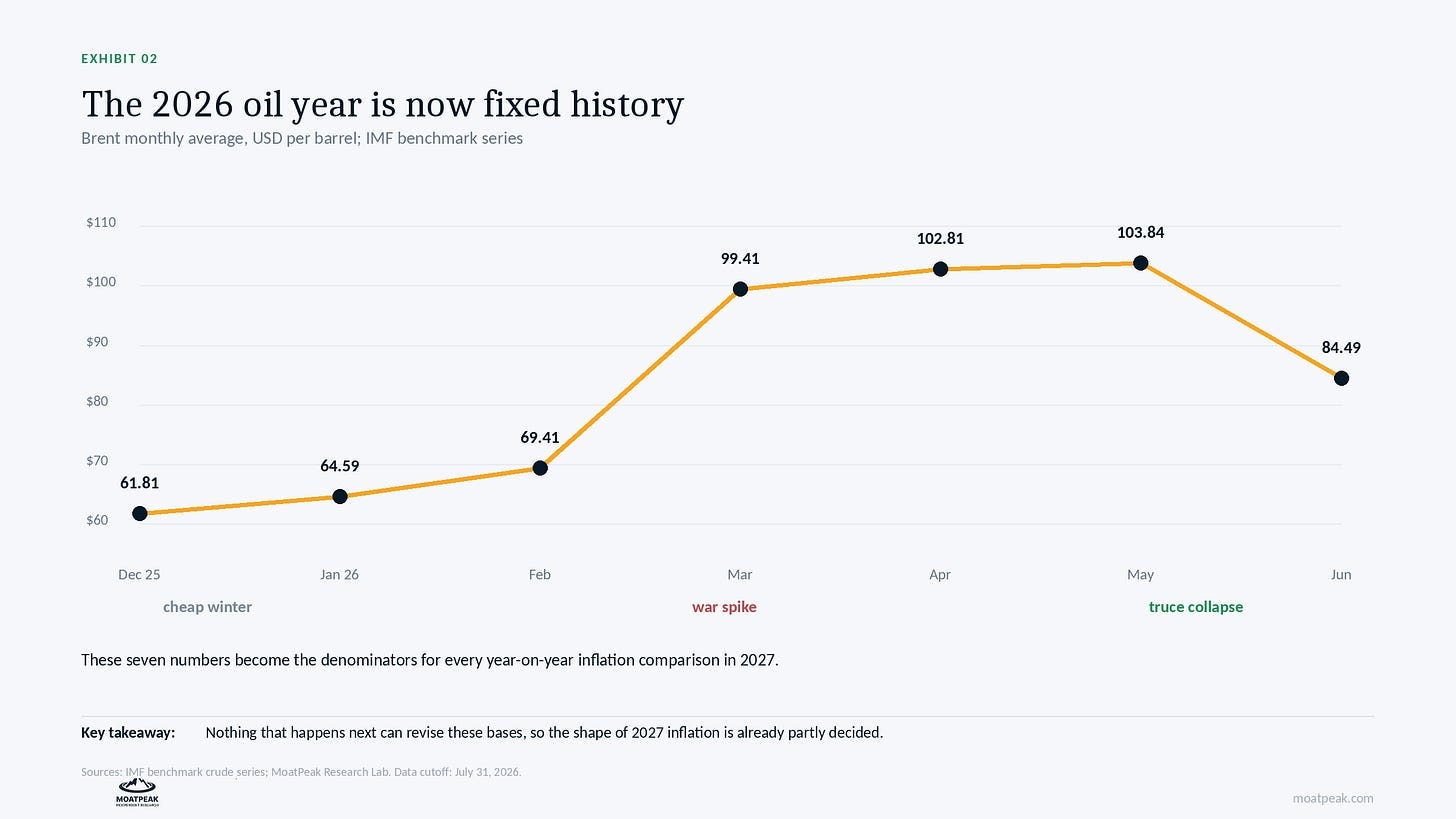
If oil stays high, December and January will show a big increase, since high prices are compared to last winter’s low prices. From March to May, the annual change drops, because prices are compared to last year’s war spike. From June on, inflation picks up again as the comparison shifts to the truce collapse, trough, peak.
The exact numbers can shift the height of the W by about a point, but the timing of each phase cannot change, since those comparisons are already set.
The policy consequence is where this is. This is where policy comes in. The spring drop is a perfect window for a central bank to cut rates and look justified by the data. The summer increase comes after the cut, which could make the decision look questionable in hindsight
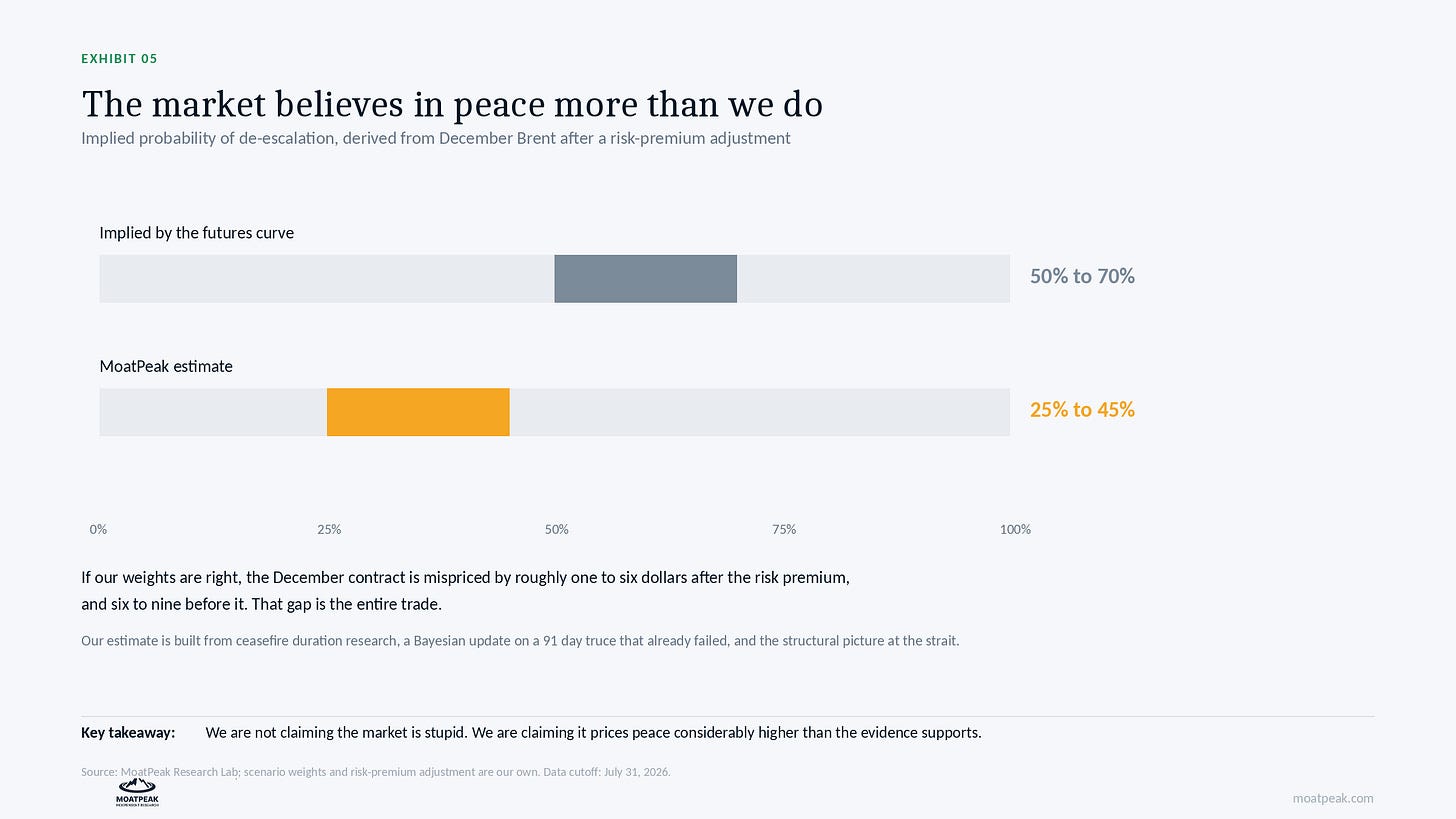
A futures price shows a weighted average of all possible outcomes. If you know what oil is worth in each scenario, you can figure out what odds the market is using.
If you do this with December Brent and adjust for the risk premium from hedging, the market is effectively giving peace a 50 to 70 percent chance.
Our own estimate, based on research into ceasefire duration, Bayesian analysis of a failed 91-day truce, and the situation at the strait, is 25 to 45 percent, centered around 35.
That difference is the whole trade. If our estimates are correct, about one to six dollars misprice the December contract after adjusting for risk premium, and six to nine dollars before adjustment.
We prefer to show you where we disagree, rather than pretend we are certain. The market is not foolish; it just has more faith in peace than we do.
What would prove us wrong
We publish these because of a thesis. We share these points because a thesis without them is just an opinion. bruised, if any of the following happen. Brent below 80 with the futures curve flipping so that later months cost more than nearer ones. Tanker transits above 100 vessels a day. Oil volatility below 45. Or two consecutive soft inflation prints.
If any of these occur, we will publish a correction using the same formulas.
We should be clear that this is a revised approach. Our public track record is 32 correct and 2 wrong, with one mistake coming from our earlier oil analysis. That is why this version is based on physical constraints and weekly government data, not just geopolitical stories.
There are three real weaknesses. Monthly averages smooth out a path that will actually be uneven. The base rate for ceasefire failure comes from research on civil wars. The amplification factor also carries the uncertainty of the shortfall estimate. All these issues point in the same direction, so we see our main scenario as a mild version, not the average outcome.
What we are watching
We are watching three numbers, all public and updated weekly or monthly.
The Wednesday reserve draw: if it stays between 3.9 and 4.4 million barrels, it confirms the election plan. The physical-to-paper spread: it is now about minus six. If it crosses zero, that means tightness is back.d.
Long-term inflation expectations: below three percent keeps the rate cut story alive, above three percent ends it.
You do not need special access, a pricey subscription, or an opinion on the Middle East to track these. You need a calendar and the discipline to check.
The full model, both trajectories with monthly bands, the gold and silver paths, and every formula are in this week’s report.
Read it free at moatpeak.com
Educational research only. Not tailored investment advice. MB “MoatPeak Group”.