


The week ended with the S&P 500 down just 0.08%, but the Nasdaq gained 0.72%, the Dow lost 1.69% and the Russell 2000 fell 1.50%. The headline benchmark concealed substantial differences in what investors were willing to own.
Our thesis in one sentence. The Fed delivered the expected hike, but the more important investment signal was a higher real cost of capital and a market recovery that did not lift all equity groups equally.
Four findings carry it.
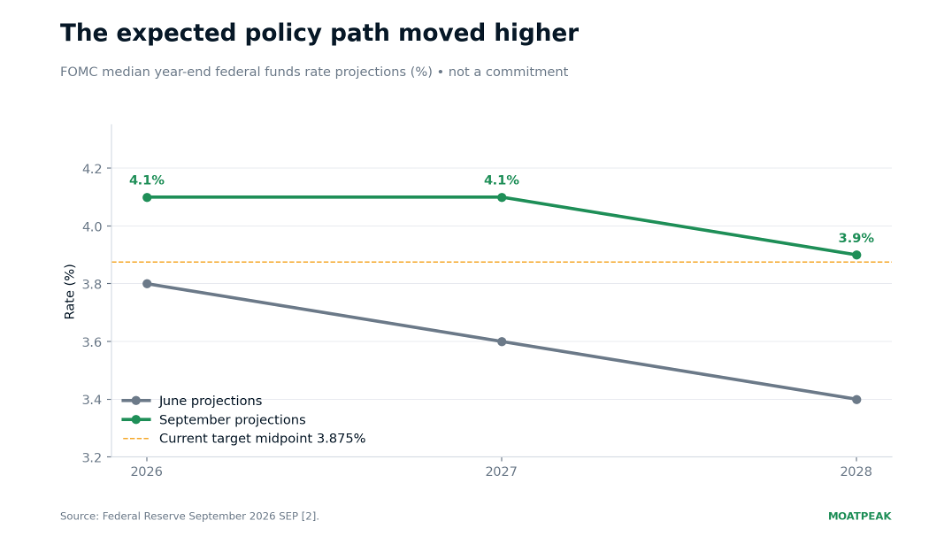
First, the policy debate moved beyond September. The Fed raised its target range by 25 basis points to 3.75%–4.00%, unanimously. The September projections put the median year-end policy rate at 4.1% in both 2026 and 2027. That is a materially different backdrop from assuming this hike will be quickly reversed.
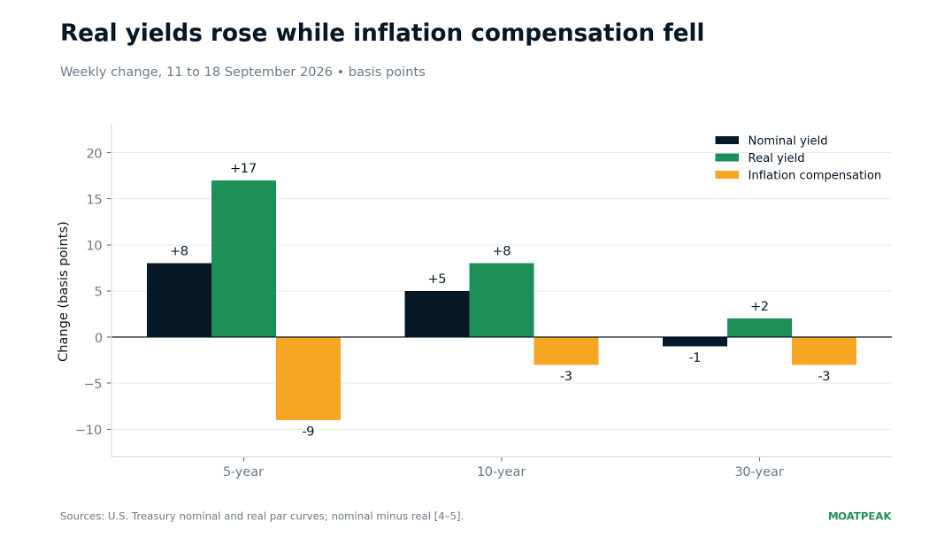
Second, the bond arithmetic strengthened the prior edition’s real-yield thesis. At five years, the nominal yield rose 8 basis points while the real yield rose 17, leaving inflation compensation 9 basis points lower. The ten-year nominal yield finished at 5.01%. Higher real yields can squeeze valuations even when inflation compensation is contained.
Third, the consumer was still spending. August retail sales rose 1.2%, including a 1.2% increase excluding autos and gasoline. Initial claims fell to 196,000. But manufacturing output declined 0.3%. The economy was resilient without being uniformly strong. These releases describe activity before the September hike could materially affect behaviour.
Fourth, the recovery was concentrated in time. The S&P 500 lost 105.17 points over Monday to Wednesday, then recovered 98.69 on Thursday and Friday. That repaired almost 94% of the decline, but it did not establish a broad improvement in financing-sensitive businesses.
The strongest argument against our cautious reading is that earnings growth and productivity can offset higher discount rates. A rising real yield can partly reflect confidence in future growth, rather than only tighter policy. If that confidence spreads into smaller companies and new orders, the market may be absorbing the hike more successfully than the weekly index split suggests.
We would become more constructive if real yields eased, oil supply improved and small caps began outperforming alongside steady employment. We would become more defensive if real yields and inflation compensation rose together while activity weakened. Neither outcome is established by one volatile week.
The Hike Was Only the Beginning
The decision removed uncertainty about the first step. The projections raised a different question: how long must policy stay restrictive before inflation returns to target? That horizon matters to asset values because a temporary increase in borrowing costs is easier to absorb than a persistent one.
A higher path does not guarantee a long hiking cycle
At the new target midpoint of 3.875%, a year-end median of 4.1% is consistent with roughly one further quarter-point increase. The distribution is informative: 12 of 18 participants projected a 4.125% midpoint for 2026, four projected 4.375% and two projected 3.875%. The median is therefore a useful centre of gravity, but it hides disagreement over the next step.
Our interpretation is that markets should test the persistence of policy, rather than trade only the next meeting. The combination of resilient demand and unresolved energy costs makes an immediate reversal harder to justify. Equally, a sustained improvement in supply or a deterioration in employment could change the path. Forecasts are conditional on an economy that will continue to evolve.
What this means for valuation
A business whose cash flows arrive far in the future is sensitive to the discount rate applied over many years. A higher policy path can also raise refinancing costs before revenues respond. The useful distinction is between companies that can fund investment internally and those whose plans depend on repeatedly accessing cheap capital. The same macro rate can have very different consequences for each.
Real Yields Did More Than Nominal Yields
The rise in the headline Treasury yield understates the change in the real return investors demanded. Inflation compensation moved in the opposite direction, partly cushioning the nominal increase. This is consistent with a stronger policy response restraining inflation risk, although the yield decomposition alone cannot prove that explanation.
Why the curve matters more than the round number
The two-to-ten-year slope narrowed from 33 to 25 basis points; the two-to-thirty-year slope narrowed from 72 to 58. These are calculated from the official Treasury par curves. The front end repriced more than the long end. That pattern fits concern about tighter near-term policy better than a simple claim that every maturity was selling off equally.
Five percent is a useful reference point, but it is not a mechanical trigger for an equity crash. Stocks respond to the combination of earnings, discount rates and risk appetite. A gradual yield rise alongside stronger profits can be manageable; a fast rise accompanied by falling estimates is a different proposition. Credit spreads and refinancing terms help distinguish the two.
The limits of the inflation signal
Nominal minus real par yields is an approximation to inflation compensation, not a pure forecast of future inflation. Risk premia, liquidity and differences between the bond curves also matter. Falling compensation is therefore evidence against an uncontrolled inflation repricing this week, but it is not proof that households or firms have stopped worrying about prices.
What the Market May Be Missing
Oil can stop rising and still remain a problem
WSJ’s settlement summary put WTI at $100.30 and Brent at $103.87, with little net weekly movement. The retreat from midweek pressure followed reports that partial pipeline flows could resume. These are contract-specific settlements; they should not be substituted with earlier intraday quotes.
The investment inference is about duration. A flat weekly oil return does not mean the cost shock has disappeared. Businesses may still face higher freight, fuel and working-capital costs than their budgets assumed. What matters for margins is the cumulative cost burden and the ability to pass it on, not just the latest five-day price change.
The Bank of England supplied a useful counterpoint
The BoE held Bank Rate at 3.75% by a 6–3 vote, with the minority preferring a hike. It reported little evidence so far of material second-round wage and price effects, while judging inflation risks to have increased. The contrast with the Fed illustrates how the same energy shock can meet different domestic conditions. [11]
For a UK-based investor, the implication is to separate global shocks from local policy responses. Domestic activity, wage growth and currency exposure can matter as much as the global commodity headline. Sterling returns on overseas assets also depend on exchange-rate movements, so the dollar-based equity scoreboard is not a UK investor’s realised portfolio return.
A credible central bank does not guarantee rising asset prices
Policy can reduce inflation risk while increasing the real return required on investments. Both outcomes can occur together. It is therefore possible for monetary credibility to improve while equity multiples contract. Investors should ask whether prospective cash-flow growth adequately compensates for that higher hurdle.
What We Are Watching
The real cost of capital
Five-year real yield: 2.55%. A sustained move above 2.65% would reinforce valuation and refinancing pressure. A move below 2.40% with stable activity would offer more convincing relief. The point is the real financing environment, not a single intraday print. [5]
The inflation component
Five-year compensation: 2.31%. A rise above roughly 2.45% while real yields also climb would be more concerning than either move alone. It would suggest investors require both more real return and more compensation for inflation risk. The measure includes risk and liquidity effects, so it needs corroboration. [4–5]
The long bond benchmark
Ten-year par yield: 5.01%. A persistent move above 5.10% alongside weaker earnings expectations would increase pressure on equity valuations. A fall below 4.85% would need interpretation: supply relief is helpful, while recession-driven demand for bonds may be much less so. [4]
The breadth of the equity response
The Russell 2000 versus the S&P 500. A durable period of small-cap outperformance, supported by improving earnings and stable credit, would challenge the view that tighter financing remains the dominant constraint. Relative gains caused only by large-cap losses would be a weaker signal.
Energy supply rather than headlines alone
Oil below $95 would be a meaningful change only if it reflected sustainable supply relief rather than collapsing demand. Conversely, prolonged triple-digit prices can sustain cost pressure even without another weekly surge. Track physical flows, refined products and company commentary together.
Employment and investment
Claims below 200,000 and stronger orders would support resilience; a sustained four-week claims average above 225,000 accompanied by weaker investment would make the growth cushion less convincing. These are our monitoring bands, not official recession criteria. Initial claims must also be read alongside hiring and continuing claims.
The research question for the next edition
Can better cash-flow expectations broaden the market while the real cost of capital remains high? That is the link between the macro data and investment outcomes. The Fed has acted; the next evidence must come from households, businesses and the prices investors are prepared to pay for their future earnings.