


Over 32 years of weekly data, there has never been a difference this large between the two. The size of this gap indicates the type of shortage we are facing.
This week, the American fuel market released two important figures, but most reports focused on the less significant one.
The national average price of diesel is currently $6.2301 per gallon, a record high. The automobile association, which monitors these prices, has listed today as the record date.
The national average price for regular petrol is $4.3163; the record figure, reached in June 2022, was $5.0165, meaning petrol is now 14% lower than its previous peak.
It is worth comparing these two numbers because together they tell a more unusual story than either one does on its own.
One is at a record high, while the other is still far from its peak.
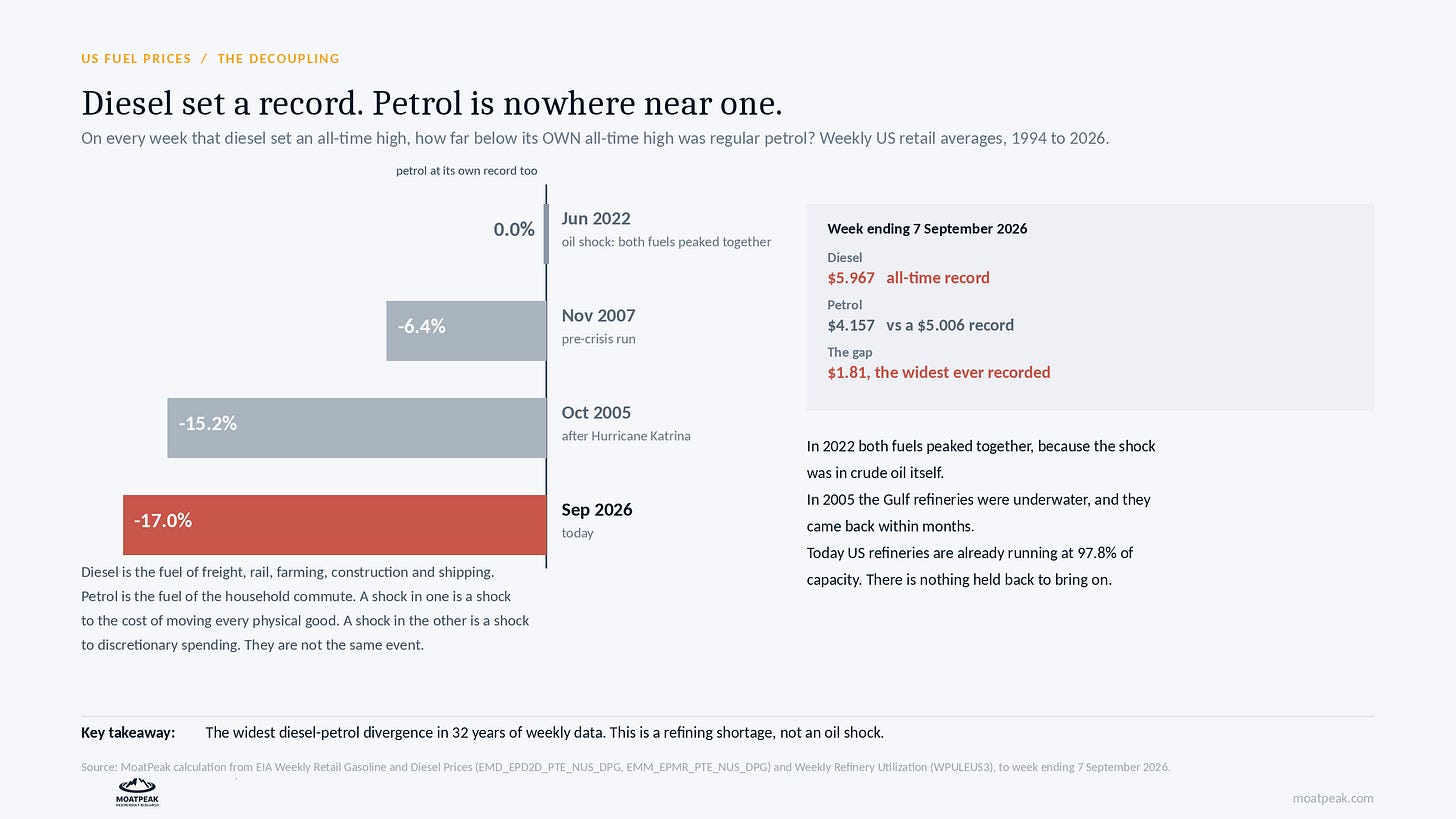
To gauge how unusual this is, we examined weekly data from the Energy Information Administration, starting in March 1994. This covers 1,695 weeks. For each week when diesel reached a new record, we asked: how far below its own record was petrol at that time? In June 2022 the answer was zero; the two fuels reached their peaks in the same two-week period. During the 2008 rise, the answer was near zero, and in November 2007 it was six per cent.
For the week ending 7 September 2026, the figure was 17 percent, the largest such gap in the series’ history.
The only similar week was in October 2005, when the gap reached 15 percent, immediately after the hurricane that flooded a quarter of U.S. refining capacity.
That comparison does matter, and we will later explain why it is not very reassuring.
What the gap actually means
A barrel of crude oil is not a single product; instead, refineries split it into petrol, diesel, jet fuel, heating oil, and various heavier products. The composition isn’t fixed, but it can’t be easily altered. A refinery designed to produce a particular output cannot simply double its diesel production all at once.
When crude oil prices rise, all other fuels also become more expensive; this happened in 2022, when the price shock began with crude oil and affected all fuels.
The issue isn’t really crude oil itself when only one type of fuel becomes expensive; it lies instead in the equipment used to produce that fuel, in demand for it, or in both.
A seventeen-point gap makes it clear that this isn’t an oil issue.
Now the number everyone is quoting, and why it is being read backward.
The key figure here is the refining margin on diesel. Refineries purchase crude oil and then sell diesel; the difference between the prices, on a per-barrel basis, is known as the crack spread. The wider the crack spread, the greater the demand for diesel relative to what refineries can currently supply.
This week, the idea is being repeated that the diesel crack has gone beyond the peak it reached in 2022.
We arrived at this figure using daily Gulf Coast diesel spot prices and daily Brent crude spot prices, both of which have been available for free since June 2006. The results are as follows.
As the most recent figures available on 9 September show, Gulf Coast diesel was priced at $4.832 per gallon and Brent crude at $109.51 per barrel. Since there are 42 gallons in a barrel, the diesel value is $202.94 based on $109.51 of crude, for a margin of $93.43.
The largest single daily increase in the twenty years occurred on 28 April 2022, when it reached $116.65.
That assertion is wrong; we are in fact 20 percent below the record level. Unless you only consider that figure, the market is not in any serious difficulty yet.
That conclusion is also incorrect, and it is this point which you need to notice.
A spike and a plateau are not the same animal.
The record set in 2022 lasted only two days, with diesel prices rising on both 27 and 28 April before dropping again; if you calculate the average margin over any 60 trading days, or roughly three months, the 2022 peak was $60.76.
The average is now $77.90, which is 28 percent higher than the lowest point in 2022, not 20 percent lower.
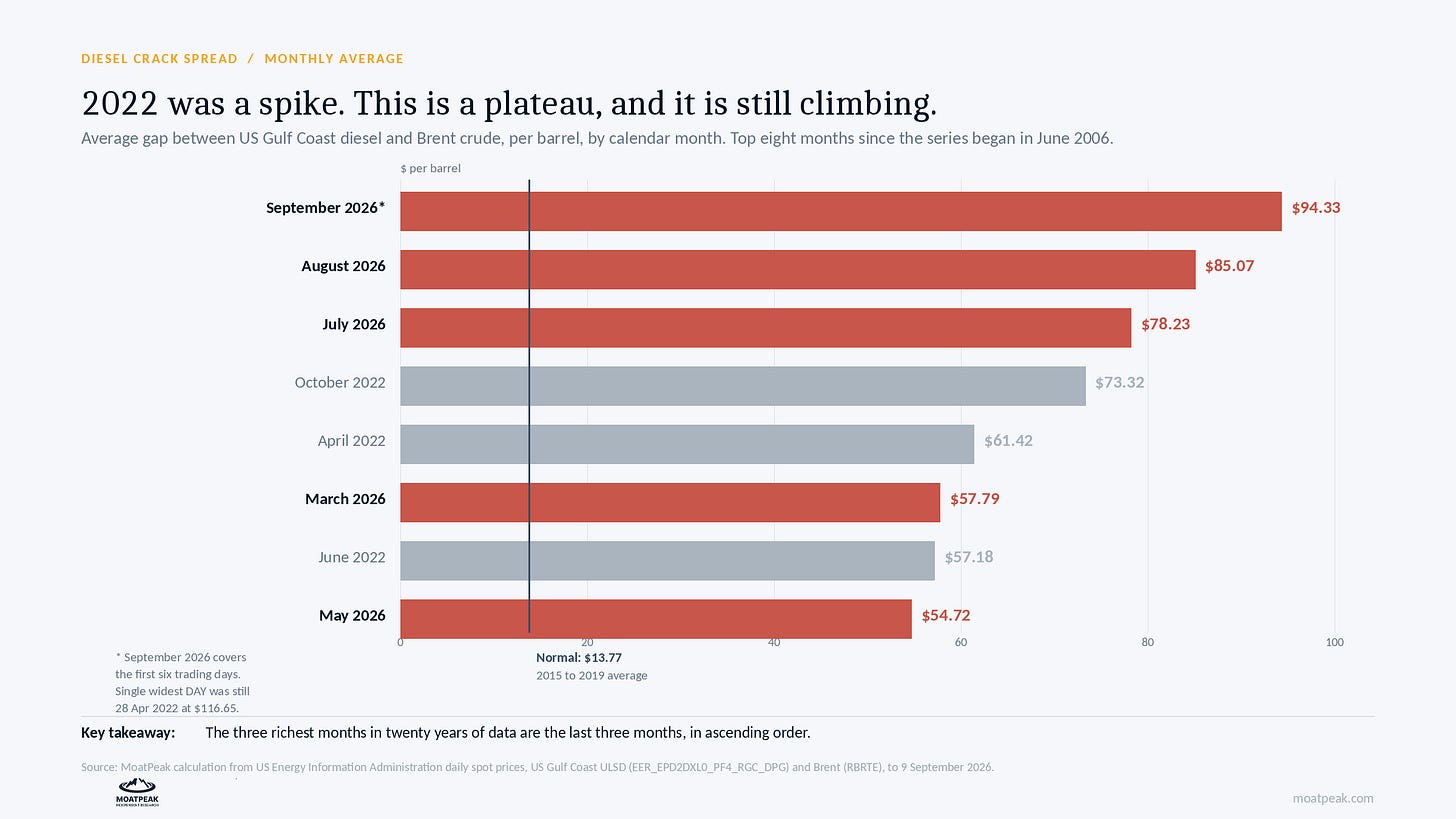
The monthly averages make the situation even clearer. The following are the three months with the highest U.S. diesel refining margins over the past 20 years:
In July 2026, it was $78.23; in August 2026, it was $85.07, and for September 2026 so far, it has been $94.33.
The highest amount 2022 generated was in October, at $73.32.
The record-high figures for the last three months mean that each of those months has set a new high compared with the one before. For comparison, the average margin from 2015 to 2019, when conditions were stable, was $13.77.
Why the 2005 comparison does not comfort us
The only previous instance when diesel and petrol prices differed so greatly was due to a hurricane. At that time the refineries in the Gulf were flooded, then repaired and brought back into operation, after which the gap disappeared within a few months. That case was a capacity outage with a definite end date.
For the week ending 4 September, American refineries are operating at 97.8 percent of capacity, and for the previous week at 98.0 percent as well; no plants are off because of flooding. The system is running at full speed, but it still cannot produce enough diesel.
The difference between an outage and a shortage is that an outage ends when the equipment is repaired, while a shortage ends only when more equipment is built or demand falls enough to have an effect.
What the policy response tells you
On 11 September Reuters stated that the White House was considering how it could use the Defense Production Act to increase American refining capacity. However, that statute has never been used to add refining capacity; the report notes that this is based on a presidential determination issued in April that authorized the act to support American petroleum production, refining and logistics.
It also gave something more revealing: when meeting a group of nearly a dozen refiners, the executives told the officials that public funds would be more usefully spent on making the existing plants more efficient or on expanding them rather than on financing a new refinery, as this would cost a great deal and would take years.
Keep in mind that when questioned about how to obtain more diesel quickly, the industry’s response was essentially that there is no quick solution.
Governments will use emergency industrial laws only if they believe the situation will not resolve itself.
What this changes for a portfolio
We are not saying diesel prices will continue to rise, since we do not know that, and the crack spread has already fallen from $102.81 on 1 September to $93.43 on the ninth. Prices are volatile.
All that can be said is that people are misinterpreting what is taking place, and this error is not a coincidence.
Diesel is used in freight, rail, farming, construction, mining, and shipping, and it represents a major expense in transporting goods. In contrast, petrol is primarily used for commuting, so a rise in petrol prices affects household spending.
If the market regards a diesel shock as merely an oil shock, it will assume that crude oil is at $109, regard this as uncomfortable but not a disaster, and then proceed. However, this perspective fails to account for the fact that the cost of moving goods is rising much faster than crude oil prices alone would indicate, and this increase has been at record levels for three months.
It also overlooks a second effect. Prices for core goods rose by 0.106 percent in August, roughly half of the 0.198 percent rise seen in July. Freight cost increases do not immediately appear in goods prices; it takes about two to four quarters for them to be reflected. The current slowdown in goods inflation is due to freight rates from earlier months.
It is not clear which businesses will be able to pass on these higher costs to their customers and which won’t.
What would tell us we are wrong
There are three points, and we shall be keeping a close eye on all of them.
If refinery utilization drops below 95 percent while the crack remains wide, then the limitation is not capacity, and our interpretation must therefore be incorrect.
If the difference between diesel and petrol falls below ten per cent again within a month, then it was just a logistics accident and not a structural shortage.
If Brent drops below $90 and the crack then follows it down, then perhaps the story was simple all along, and we misinterpreted the decoupling.
We are recording those three figures as they are today, and we will let you know about any changes.
The sources so that you can check us
We obtained all the figures presented here from files we downloaded and worked out ourselves. The retail prices are from the EIA’s weekly series for gasoline and diesel, covering the period from March 1994. The daily spot prices for Gulf Coast ultra-low sulfur diesel and for Brent crude are from the EIA’s daily series, starting from June 2006. The refinery utilization data from the EIA’s weekly petroleum status report. The daily national averages for today from the automobile association’s public price page. The refining capacity report from Reuters dated 11 September.
All of this data is free to access, and the calculations are simple. The fact that the widely shared version of this story is wrong in both directions shows how rarely people check information.
Educational research only. Not personalized investment advice. MB “MoatPeak Group”.