


Nobody increased their level of exposure since they had simply decided no longer to bet against the market.
The Commodity Futures Trading Commission releases each week a list showing who holds what in the futures market, with the information divided by kind of trader; the list is free, it is in the form of a spreadsheet and it is the nearest thing to a public record of positions that is available. Almost no one reads it.
We looked at the four reports relating to the E-mini Nasdaq 100 contract for the period from August 11 to September 1, and as a result the meaning of a figure you may have come across is altered.
The number being quoted
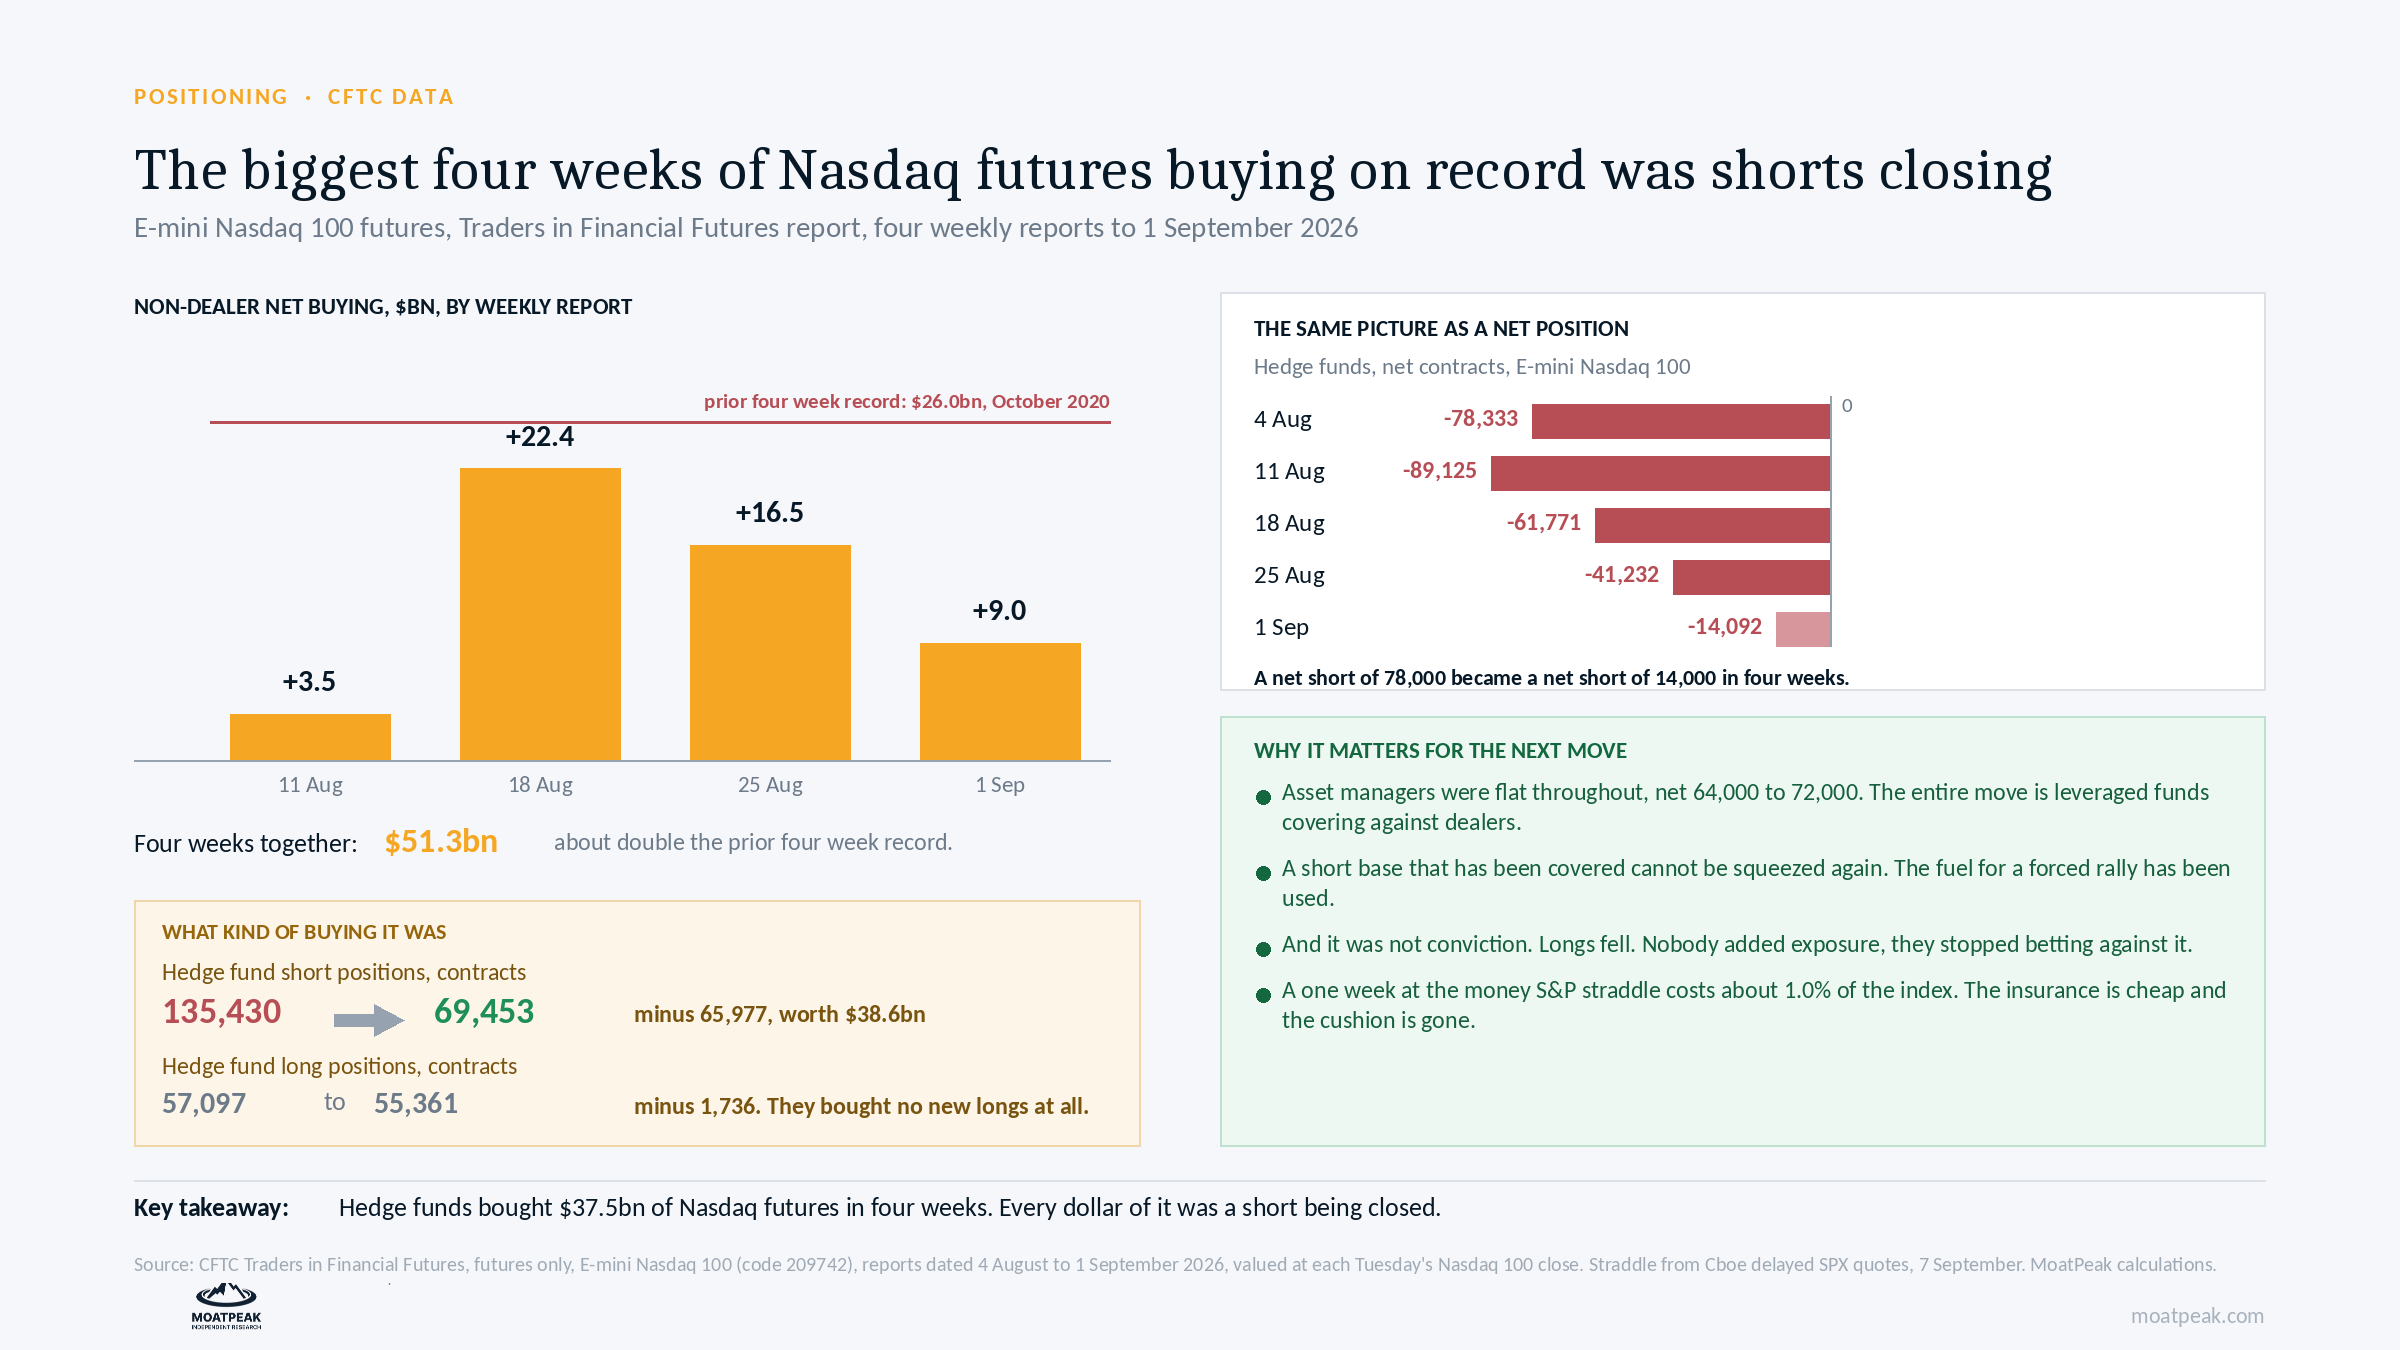
There may be headlines referring to a “record amount of $51.3 billion” in Nasdaq positioning. Although the figure is accurate, the thing that it actually measures is different from what the phrase implies.
The amount covers four weeks’ worth of purchases: $3.5 billion for the week ending August 11, $22.4 billion by August 18, $16.5 billion by August 25, and $9.0 billion by September 1. The figures exclude dealers and are based on the closing value for each Tuesday.
When measured by the amount spent over a four-week period, this figure is the highest that the CFTC has ever recorded since 2006; the previous record, set in October 2020, was around $26.0 billion, meaning that this time it is almost double.
It is not a record in terms of position. The net amount is now about $45.8 billion, as against $54.2 billion at the same time last November. A week before this buying began, when the period ended on August 4, there had been a sale of $21.6 billion. Hence, the record buying started from a deficit.
What kind of buying it was
What is important is contained in the same file.
If you analyse the category of leveraged funds, which includes hedge funds, you can find their long and short positions separately.
On 4 August the number of short positions was 135,430, dropping to 69,453 by 1 September, a decrease of 65,977 contracts, equivalent to about $38.6 billion.
On 4 August the number of long positions was 57,097 and on 1 September it was 55,361, a decrease of 1,736.
The entire $37.5 billion worth of net buying by the hedge funds resulted from them closing out their short positions. Their long positions didn’t increase; in fact they decreased slightly. The record amount of buying was not due to the funds deciding to hold more Nasdaq shares. It was all about ending their short positions.
Their net position changed from being short by 78,333 contracts to being short by 14,092. A huge bet against the index was cancelled within four weeks and no new bet was made in its place.
And the other side of the table did nothing
Throughout the period asset managers, such as pension funds and long-only institutions, maintained a net long position ranging between 64,000 and 72,000 contracts, their positions remaining unchanged. The entire change resulted from leveraged funds covering shorts, the dealers taking the other side.
It is important to take this into account since the positioning number that has been quoted most frequently this month indicates that one group had closed their bets while the other group took no action.
Why it matters for whatever comes next
The two factors which normally tend to slow down the market have vanished at the same time. Instead, we choose to explain this change rather than offer any predictions about it.
The short position has now vanished. In order for a squeeze to take place there must be shorts to squeeze. A month ago there were 135,000 short contracts but now there are 69,000. Most of the fuel needed for a forced rally has already been used.
Strong buying did not take the place of that shift. If the short covering had been accompanied by new long positions, this would have indicated that the market had discovered new buyers. However, that did not occur and the long positions in fact decreased. The fact is that those who had been betting against the index ceased to do so and nobody stepped in to take their place.
Meanwhile, the price of market insurance has fallen. Currently, a one-week at-the-money S&P 500 straddle – this being the simplest method of speculating on a move in the index – costs around 1.0% of the index, according to latest exchange quotes, whereas up to and including the Federal Reserve’s meeting on the 18th it amounted to about 1.7%.
The counter, which we take seriously
Light positioning can have effects in both directions, and we won’t pretend that it only works in one way.
A market which has already removed the risks is also one which has less to offer for sale. If the inflation figures this week are weak and the plan to raise rates in September is abandoned, then a market with no short positions left is precisely the type that rises by large gaps, since there is nothing above it. Many trading desks interpret the situation in that way and might be correct.
Our point is not about which direction the market will move, but about how much resistance it will face. The next big move, up or down, will meet less resistance than a month ago because both usual shock absorbers are gone. This is about the size of the move, not its direction.
What would prove us wrong
If, between now and October 31, the index moves by less than 5% in either direction even though there have been two inflation reports, a Federal Reserve decision, and the September options expiry, then the fact that the shock absorbers had been removed wasn’t as important as we had originally thought.
The habit
If you are told that hedge funds have bought something, find out whether they actually carried out the purchase or merely ceased short selling it. The figure provided by the CFTC, which is available free of charge every Friday, illustrates the distinction. Although both “hedge funds bought $37.5 billion” and “hedge funds closed $38.6 billion of shorts” refer to the same four-week period, they convey very different meanings regarding conviction.
Our full research is at moatpeak.com.
Educational research only. Not personalized investment advice. MB “MoatPeak Group”.