


It is this difference that tells you how you should protect your investments.
The news today is filled with reports of a worldwide bond sell-off. Japan’s thirty-year yield is at a record high. Britain’s yield is at levels last seen in the 1990s. The American ten-year yield is at its highest point so far this presidential term. The usual explanation for this is that bond markets are seeking a higher real return, governments have borrowed too much, and a reckoning is now taking place.
The facts in question are generally correct, but the explanation isn’t.
We obtained the two daily files from the US Treasury and one from Japan’s Ministry of Finance; the process of going through them takes only a few minutes and thus points to an alternative narrative.
Start with the month nobody checked
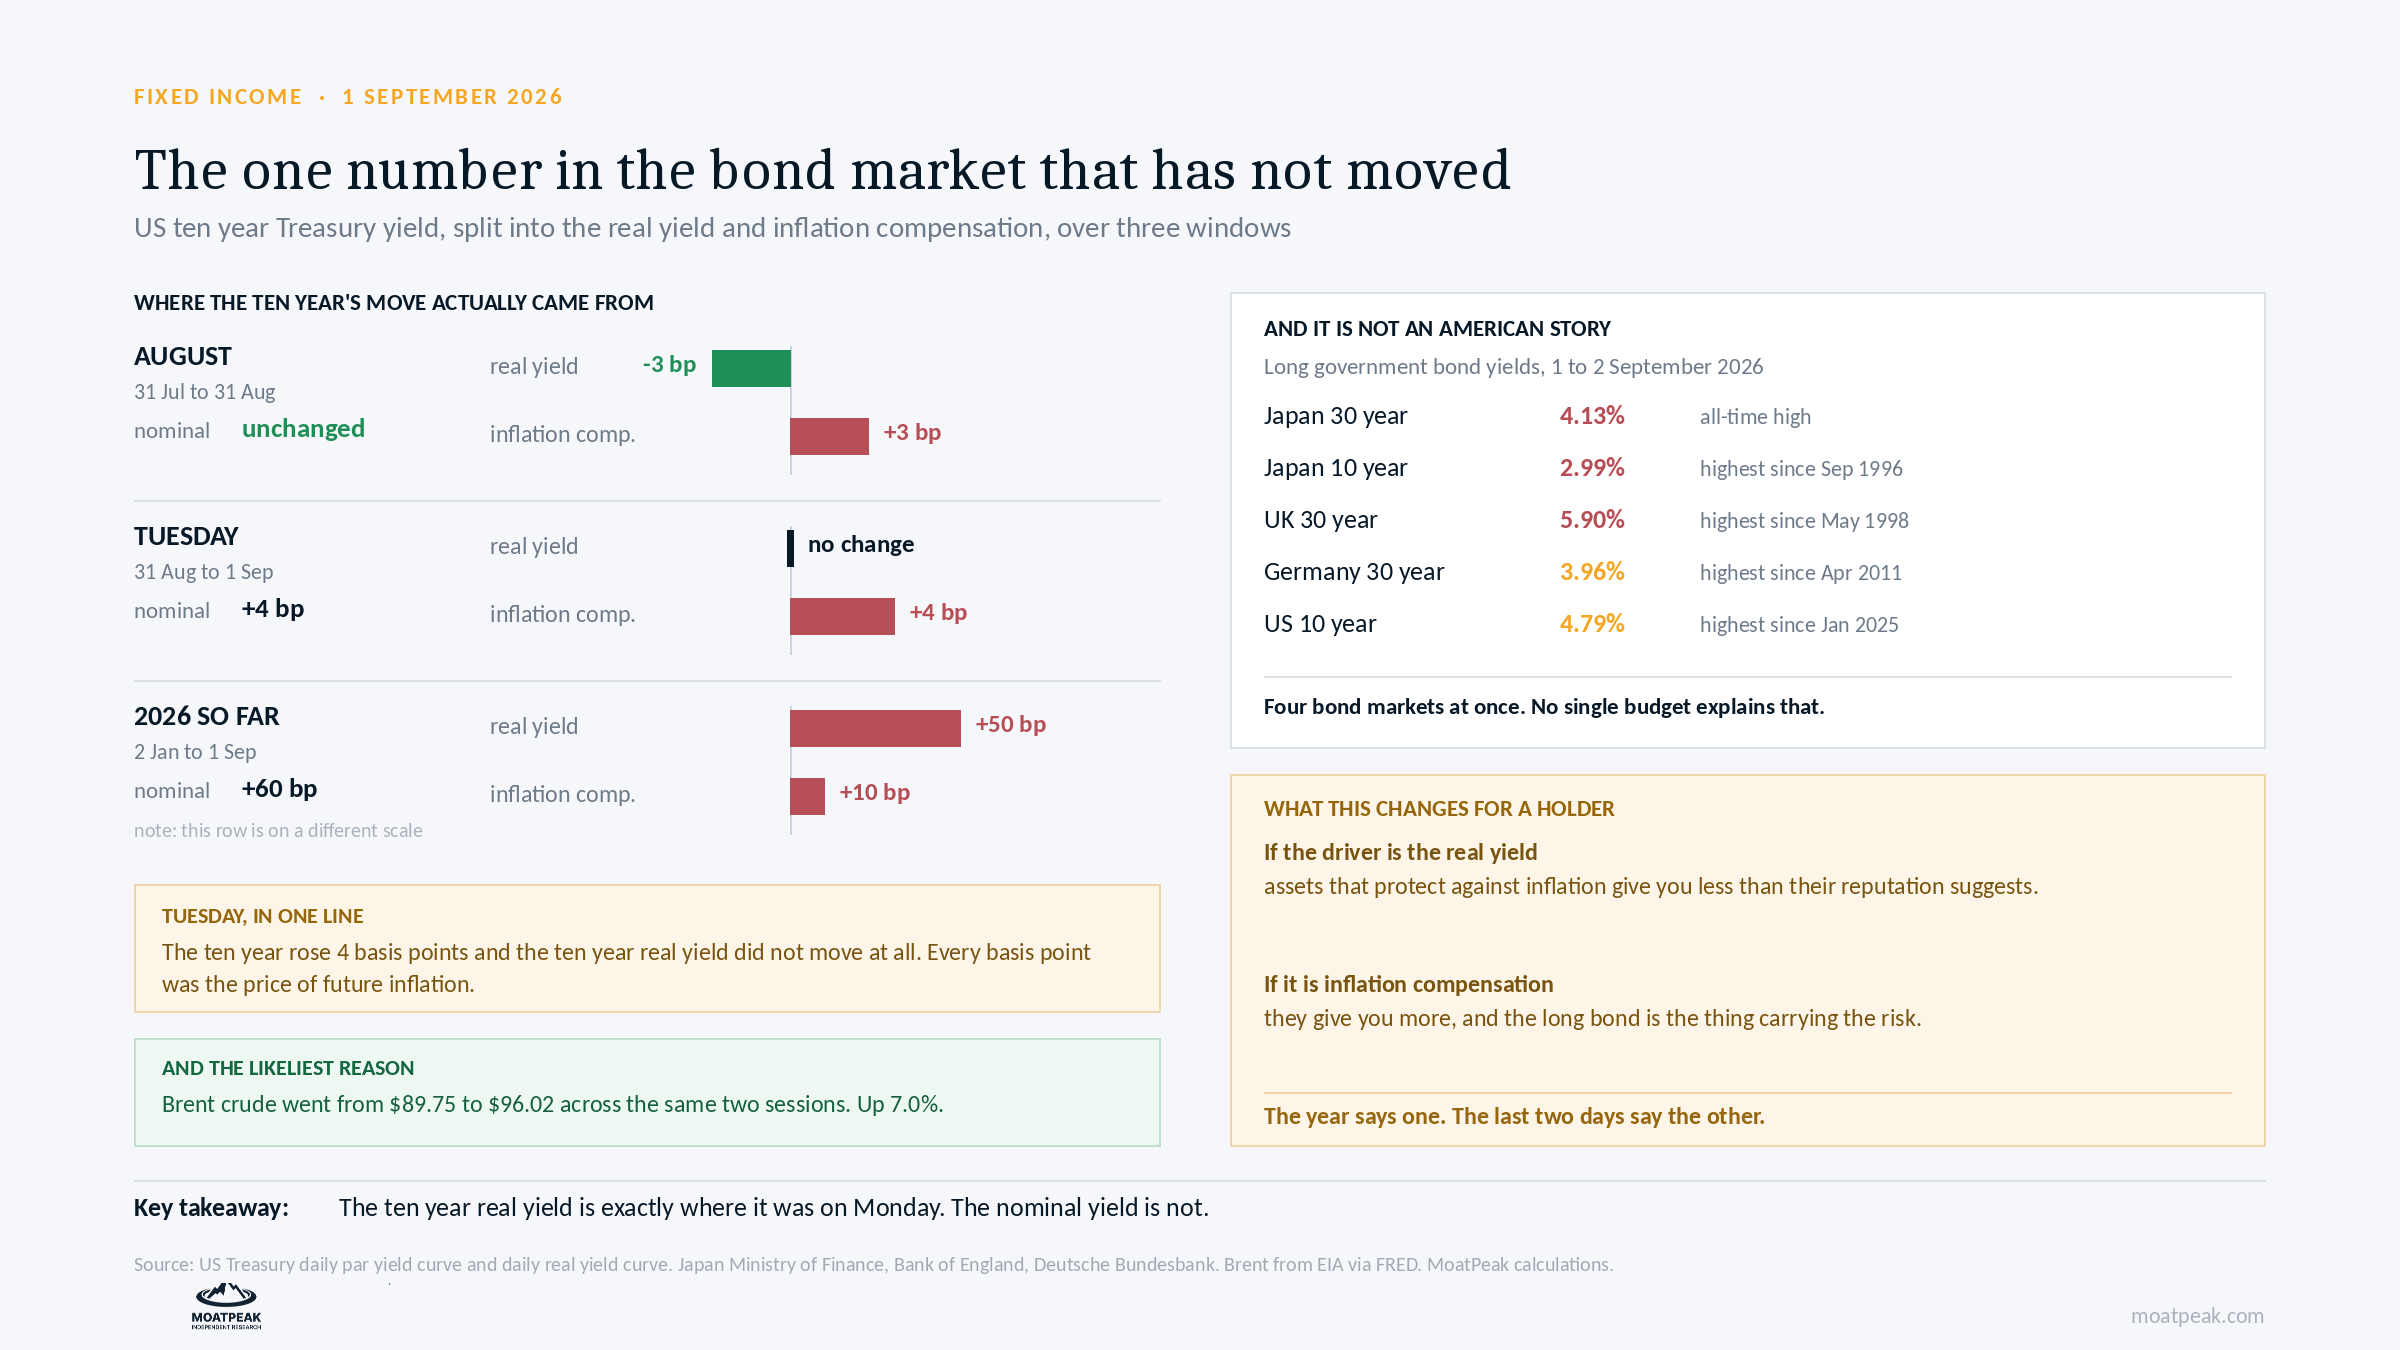
The ten-year Treasury yield was at 4.75% at the end of July and was also at 4.75% at the end of August.
There was no change, but below that flat line, all the rates on the Treasury’s real yield curve fell: the five-year rate fell by one basis point, the seven-year by three, the ten-year by three, the twenty-year by four, and the thirty-year by four as well. Inflation compensation, that is to say the nominal yield less the real yield, rose by three basis points.
In August, the only section of the curve to rise was the shorter end, the three-month rate increasing by 8 basis points, the one-year by 8, and the two-year by 6 as well. Since this part of the curve is affected by the Fed, during August, the market had been expecting a rate rise at the September meeting.
Then look at Tuesday, which is the part being written about
On the 1st of September, the ten-year rate increased by 4 basis points to 4.79%, which is its highest level since January 2025.
On 1 September, the real yield for ten years was 2.44%.
On 31 August, the real yield for ten years was 2.44%.
It remained unchanged. The entire rise on Tuesday was due to an increase in inflation compensation, which rose from 2.31% to 2.35%. This is even more evident in the case of the five-year bond: the nominal yield increased by 6 basis points, but the real yield didn’t change.
On Tuesday, the market was not calling for a higher real return; rather, it raised the expected cost of future inflation.
And there is an obvious reason sitting next to it
Brent crude rose from $89.75 to $96.02 over the same two sessions; this represents an increase of 7.0% over two days and a rise of about 35% since the conflict in the Middle East started in February.
With the rise in oil prices, expected inflation increases; higher expected inflation causes nominal bond yields to go up while leaving real yields unchanged. That is precisely what took place over the past two days, and it is quite different from the bond market losing confidence in a government.
The part that is genuinely global, and the part that is not
The fact that these actions have a global character is genuine, and that is the main strength of the argument we are disputing.
The thirty-year yield in Japan has reached 4.13 percent, which is a true record high according to the Ministry of Finance’s own series, which starts in 1999. The ten-year rate, at 2.99 percent, is the highest level it has been since September 1996, a figure which is more striking, and yet almost no one is using it. The thirty-year yield in the UK is 5.90 percent, the highest it has been since May 1998. Germany’s thirty-year yield of 3.96 percent is also at its highest level since April 2011.
Although two of them are said to be records, they aren’t. The highest rate ever in Britain, according to the Bank of England’s long series, was 8.66 percent, which occurred in May 1992, and Germany’s record was 6.27 percent in 2001. It is remarkable that the figures span twenty-eight years and fifteen years respectively without anyone needing to exaggerate, and any reader who looks it up will immediately notice the overstatement.
Yet the trend is clear in that the four major bond markets are all changing at the same time. It is impossible for the budget of a single government to account for developments occurring simultaneously in Tokyo, London, Berlin, and Washington. Someone who hopes that an American fiscal remedy will cause the long-term US bond yields to fall is simply waiting for a solution which, even if it were to materialize, would still not be sufficient.
Now the honest half, because the year says something different
It is better to say this ourselves than for someone else to notice it.
When you look at the year so far in 2026, the real yield story is perfectly accurate. Starting on the first trading day in January, the ten-year yield has risen by 60 basis points, reaching from 4.19% to 4.79%. Of this increase, 50 basis points are due to the real yield and 10 basis points to inflation compensation. Therefore, 83% of this year’s movement is the result of the real rate.
So both explanations are correct, but they apply to different time frames. This year has been about real rates. The last two days have been about inflation. Anyone saying that Tuesday proves the year’s main story is mixing up two separate forces that just happen to move the headline number the same way.
Why this is not pedantry
Since these two forces demand different methods of self-protection.
If real returns are rising because the market is demanding a higher real return, then inflation-linked bonds, gold, and commodities will not be as helpful as people believe, since the issue is not inflation.
When the reason why yields are going up is that the market anticipates higher inflation, it means that these assets are carrying out precisely the role they are supposed to carry out, and in that case the real risk lies with ordinary long-term bonds.
An investor who read the news this week and went with the first explanation has ended up guarding against the incorrect risk during the two days when in fact the second risk was the one that was present.
What would prove us wrong
If in the following month the ten-year yield exceeds 4.95% and the ten-year real yield increases by more than 20 basis points as a result of that rise, then the real rate explanation will apply to both the present instance and to the previous year. We will make this clear. The indication in this case would be that the inflation compensation remains the same or falls even though the nominal yield rises.
The second clue is oil; if the price of Brent falls below $85 and the long-term yields continue to rise, then our explanation is incorrect and it must be that some structural factor is causing the change.
The habit worth stealing
When anyone gives an explanation about a change in bond yields, you should find out which part of the yield has changed.
The United States Treasury releases both a par yield curve and a real yield curve each afternoon in the form of spreadsheets, and if you take one away from the other you obtain the market’s estimate of future inflation for each maturity. Similarly, Japan’s Ministry of Finance, the Bank of England and the Bundesbank also make their data available in the same manner.
All it takes is a few minutes, since it’s the difference between merely knowing that yields have gone up and actually understanding why – which in turn is essential for knowing what action to take.
The research we carry out every day, including the tests which we publish in advance and evaluate ourselves, can be found at moatpeak.com.
Educational research only. Not personalized investment advice. MB “MoatPeak Group”.