


No payment has been made, there is nothing shown on their balance sheets, and you can check this for yourself in about twenty minutes.
Begin by looking at the strong point, since it is both true and important.
The profits are genuine. This year 86 per cent of the companies in the S&P 500 have exceeded expectations, which is the highest figure since 2021. Someone who says that artificial intelligence has not generated any profits is not looking at the filing documents.
Now turn your attention to the following statement.
But the cash tells a different story
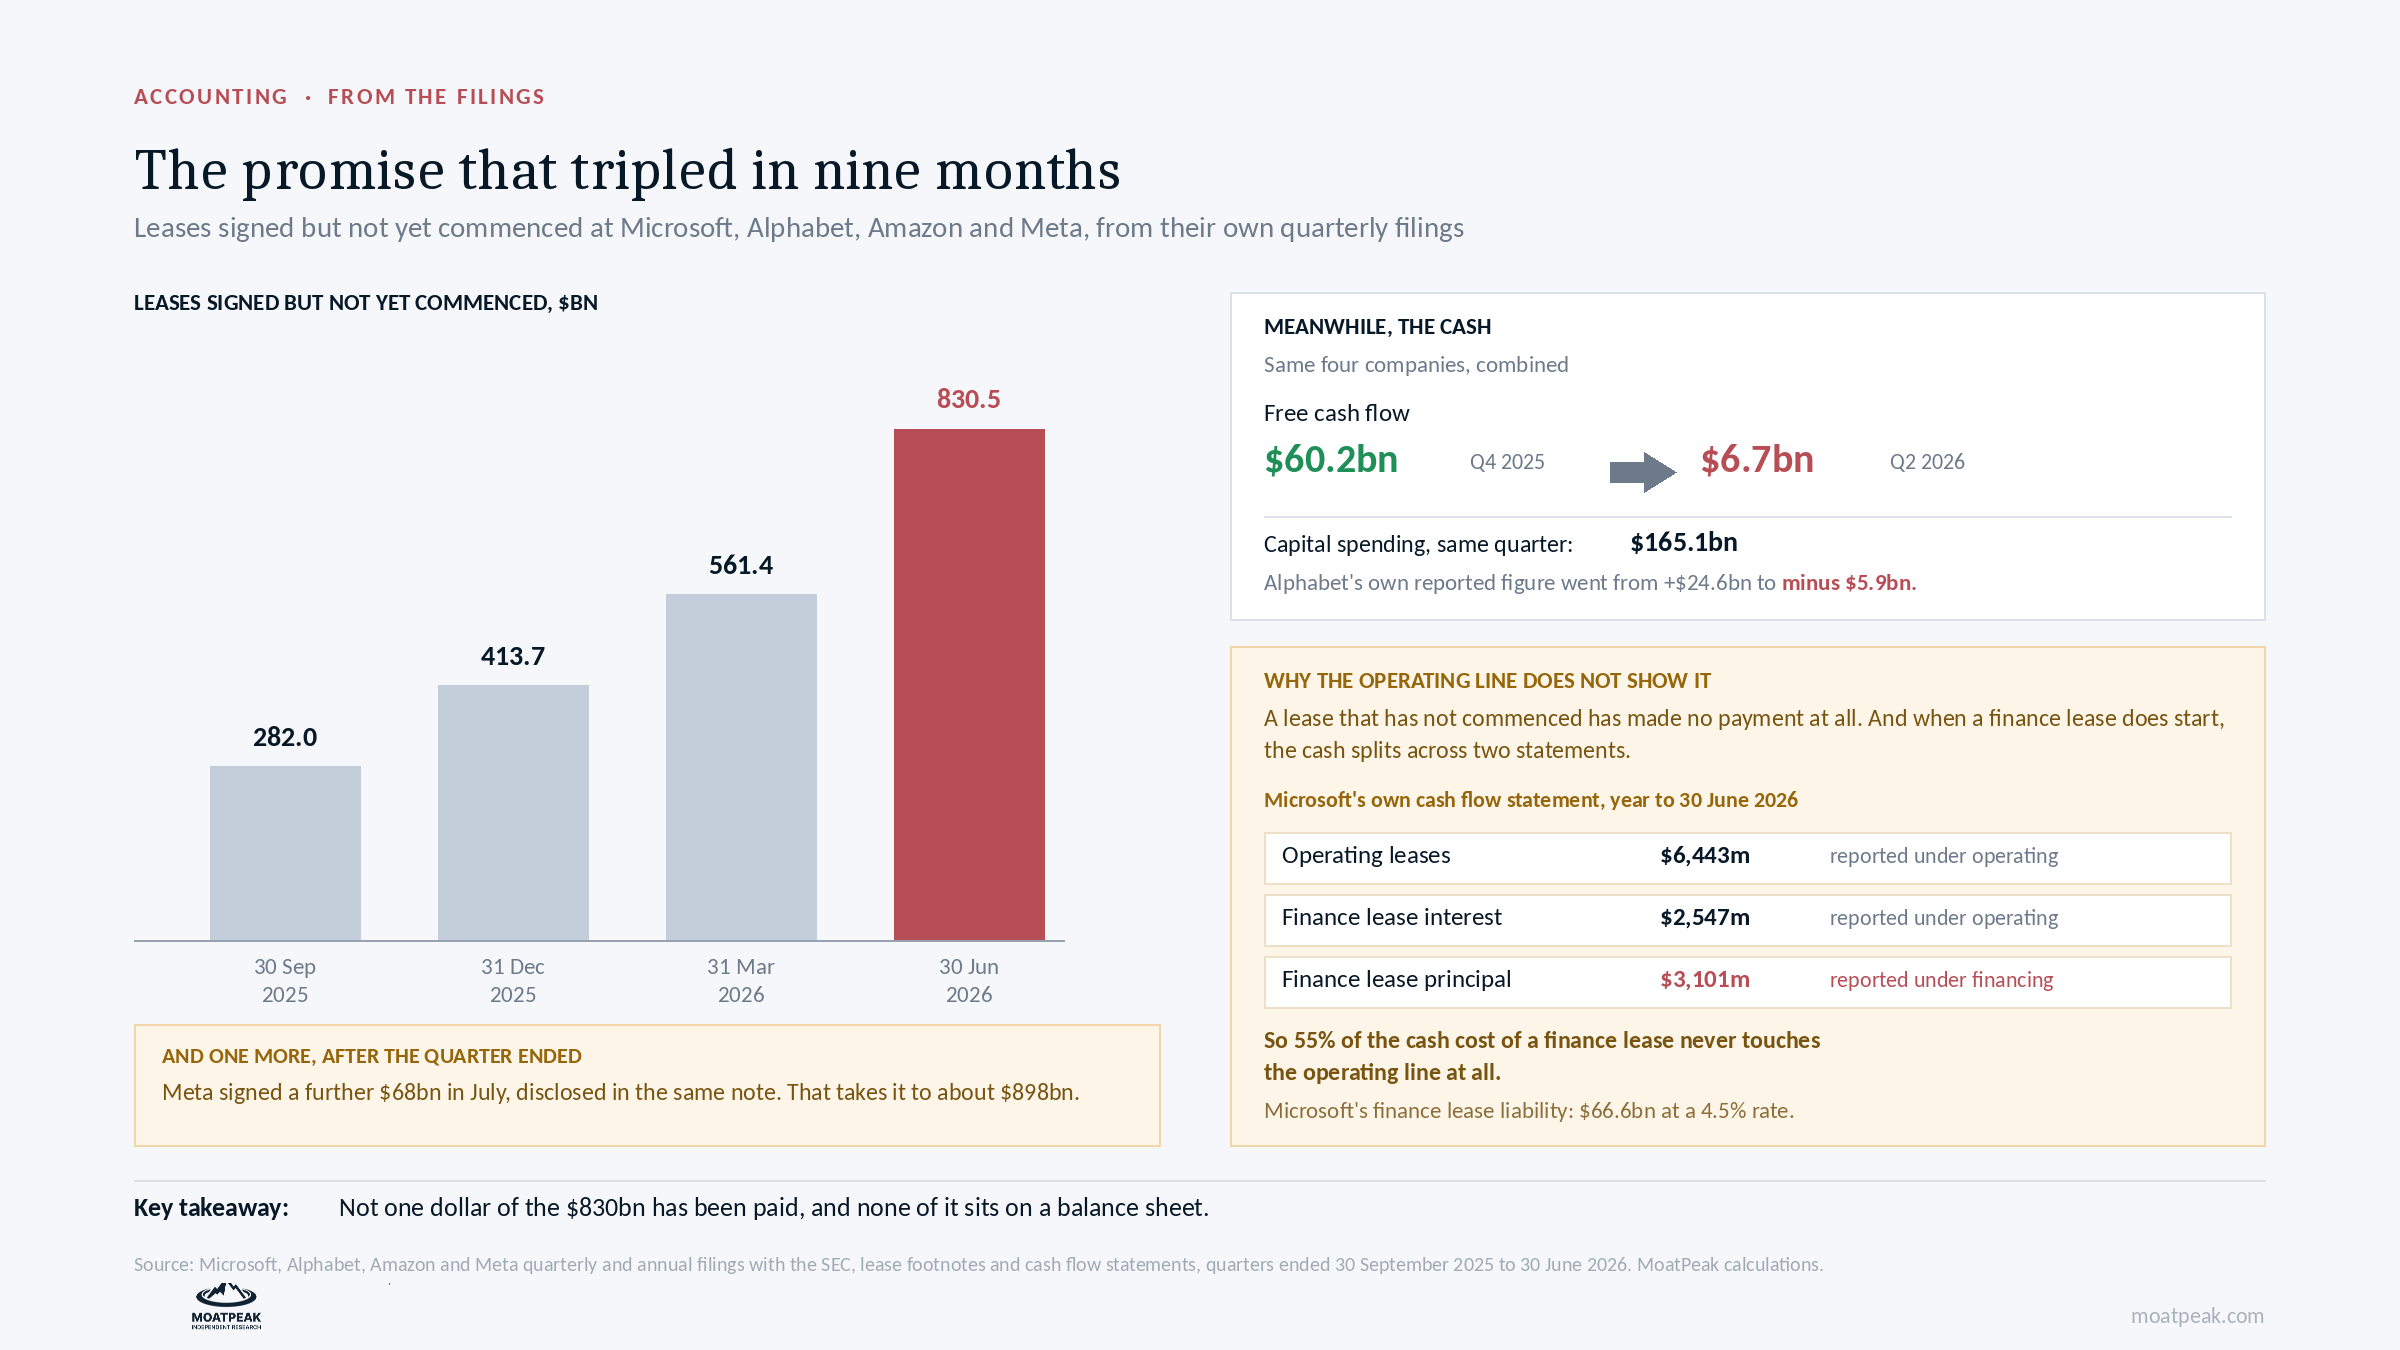
When you add up the amounts spent by Microsoft, Alphabet, Amazon, and Meta, the total for property and equipment in the quarter that ended June 30, 2026, was $165.1 billion, which is an increase from $129.8 billion in the prior quarter.
In the same period their total free cash flow fell from $60.2 billion in the quarter ending in December to $6.7 billion in the quarter ending in June.
You won’t need a chart to realise this. In the December quarter Alphabet recorded free cash flow of $24,551 million and in the June quarter suffered a free cash flow of $5,855 million. Amazon too has a negative free cash flow over the past twelve months while Microsoft stays comfortably positive.
Accounting profit and cash flow are not the same; for the past two years the market has paid for profits on the assumption that cash would follow.
However, there’s another section which isn’t reflected in those figures.
All leases which a company has signed but not yet commenced are shown only in the footnote relating to leases and not on the balance sheet or in any of the cash flow statements, because no payments have been made.
We added up the disclosures for all four companies, one quarter at a time.
September 30, 2025: $282.0 billion. December 31, 2025: $413.7 billion. March 31, 2026: $561.4 billion. June 30, 2026: $830.5 billion.
The figure has tripled over a period of nine months; Microsoft’s portion rose from $92.7 billion the previous year to $329.1 billion, with the leases in question beginning between 2027 and 2033, while Meta contributed an additional $68 billion in July, which raised the total for the group to around $898 billion.
The figure of $388 billion that is being cited this week was not reported by any of these companies at any of their quarter ends. The true total is more than twice as big.
Why the operating cash flow line does not give you the full picture
The following section is technical, but it’s worth taking a quick look at it.
A lease agreement which has been signed but hasn’t yet begun entails no payments at this stage; it is merely a written commitment with no money having changed hands yet.
At the beginning of a finance lease, the cash is divided between two different statements. The interest is included in the operating cash flow and the principal is recorded in the financing section. For instance, in its annual cash flow statement, Microsoft shows $6,443 million in operating lease payments and $2,547 million in finance lease interest under operating cash flow and $3,101 million in finance lease principal under financing.
According to Microsoft’s figures, around 55% of the cash cost associated with its finance leases does not show up on the operating line. The amount of its finance lease liability is $66.6 billion and has a weighted average rate of 4.5% over a period of thirteen years.
The actual effect is that the more frequently companies prefer leasing over buying, the better their operating cash flow appears. Consequently, free cash flow—which is determined by taking operating cash flow and subtracting capital spending—fails to take into account an ever-larger share of these obligations.
The counter-argument, which is strong
A genuine build is just as much characterised by spending well in advance of revenue as it is by being in a bubble. The companies which were laying down fibre in the late 1990s also had very negative free cash flow, and in some cases they were simply early rather than mistaken. Nothing can be concluded from the result of one quarter.
The demand is undoubtedly real and increasing. On Monday Dell announced that its revenue had increased by 58% to $47.0 billion, adjusted earnings per share rose by 203% to $7.04, and orders for artificial intelligence servers reached a record $60.9 billion with a backlog of $95 billion. The company’s full-year revenue guidance was raised from $167 billion to $192 billion. Traditional data center servers and networking saw growth of 122% to $10.5 billion, which outstripped the overall figure. This demonstrates that demand for artificial intelligence extends well beyond graphics processors and therefore undermines the narrow bear case, including parts of our own view.
It should be noted what Dell points out, namely that orders amount to $60.9 billion as against recognised revenue of $16.4 billion. Since these are different figures, the higher one reflects future commitments.
There is one correction to make about the earnings figures themselves.
You might come across reports stating that index earnings increased by 52% this quarter; that figure is the real blended amount and represents the highest value since 2021.
But the figure is increased by two items: Alphabet had unrealized gains of about $98 billion in other income and Amazon contributed about $53.4 billion, mainly from its share in a private company. If these two items are excluded, the index growth amounts to 33.8% and the remaining 493 companies experienced a growth of 31.8%.
A quarter with a 32% increase is still very good; it isn’t 52%, the reason being that two companies have increased the value of assets which they have not sold.
What we believe this means
The market believes that artificial intelligence leads to revenue and accounting profits; however, it has not yet had to show that these profits result in cash which shareholders can actually get.
According to the filings, the proof is moving further away from it, not any closer; there are now nearly $900 billion worth of promises queued up before it, and none of it has yet been paid.
What could prove us wrong
If the four companies’ combined free cash flow becomes positive in the quarter ending September then the decline would have been due only to timing and our argument would therefore be less strong. Although the consensus estimates vary, we do not assert that there is one published figure.
If the total for not-yet-started leases falls on September 30, or grows by less than $50 billion, then the escalation has stopped and the strongest part of this argument no longer holds.
A useful habit
If a company exceeds expectations, look at the cash flow statement first and then check the lease footnote.
Profit is merely a matter of opinion concerning the timing, whereas cash is a fact. A lease is just the same as a purchase, except that the commitment is expressed in words rather than in numbers on the financial statements.
The information in question is free to obtain from the filings on sec.gov, and the process takes around twenty minutes.
For more information about our research, visit moatpeak.com.
Educational research only. Not personalized investment advice. MB “MoatPeak Group”.