


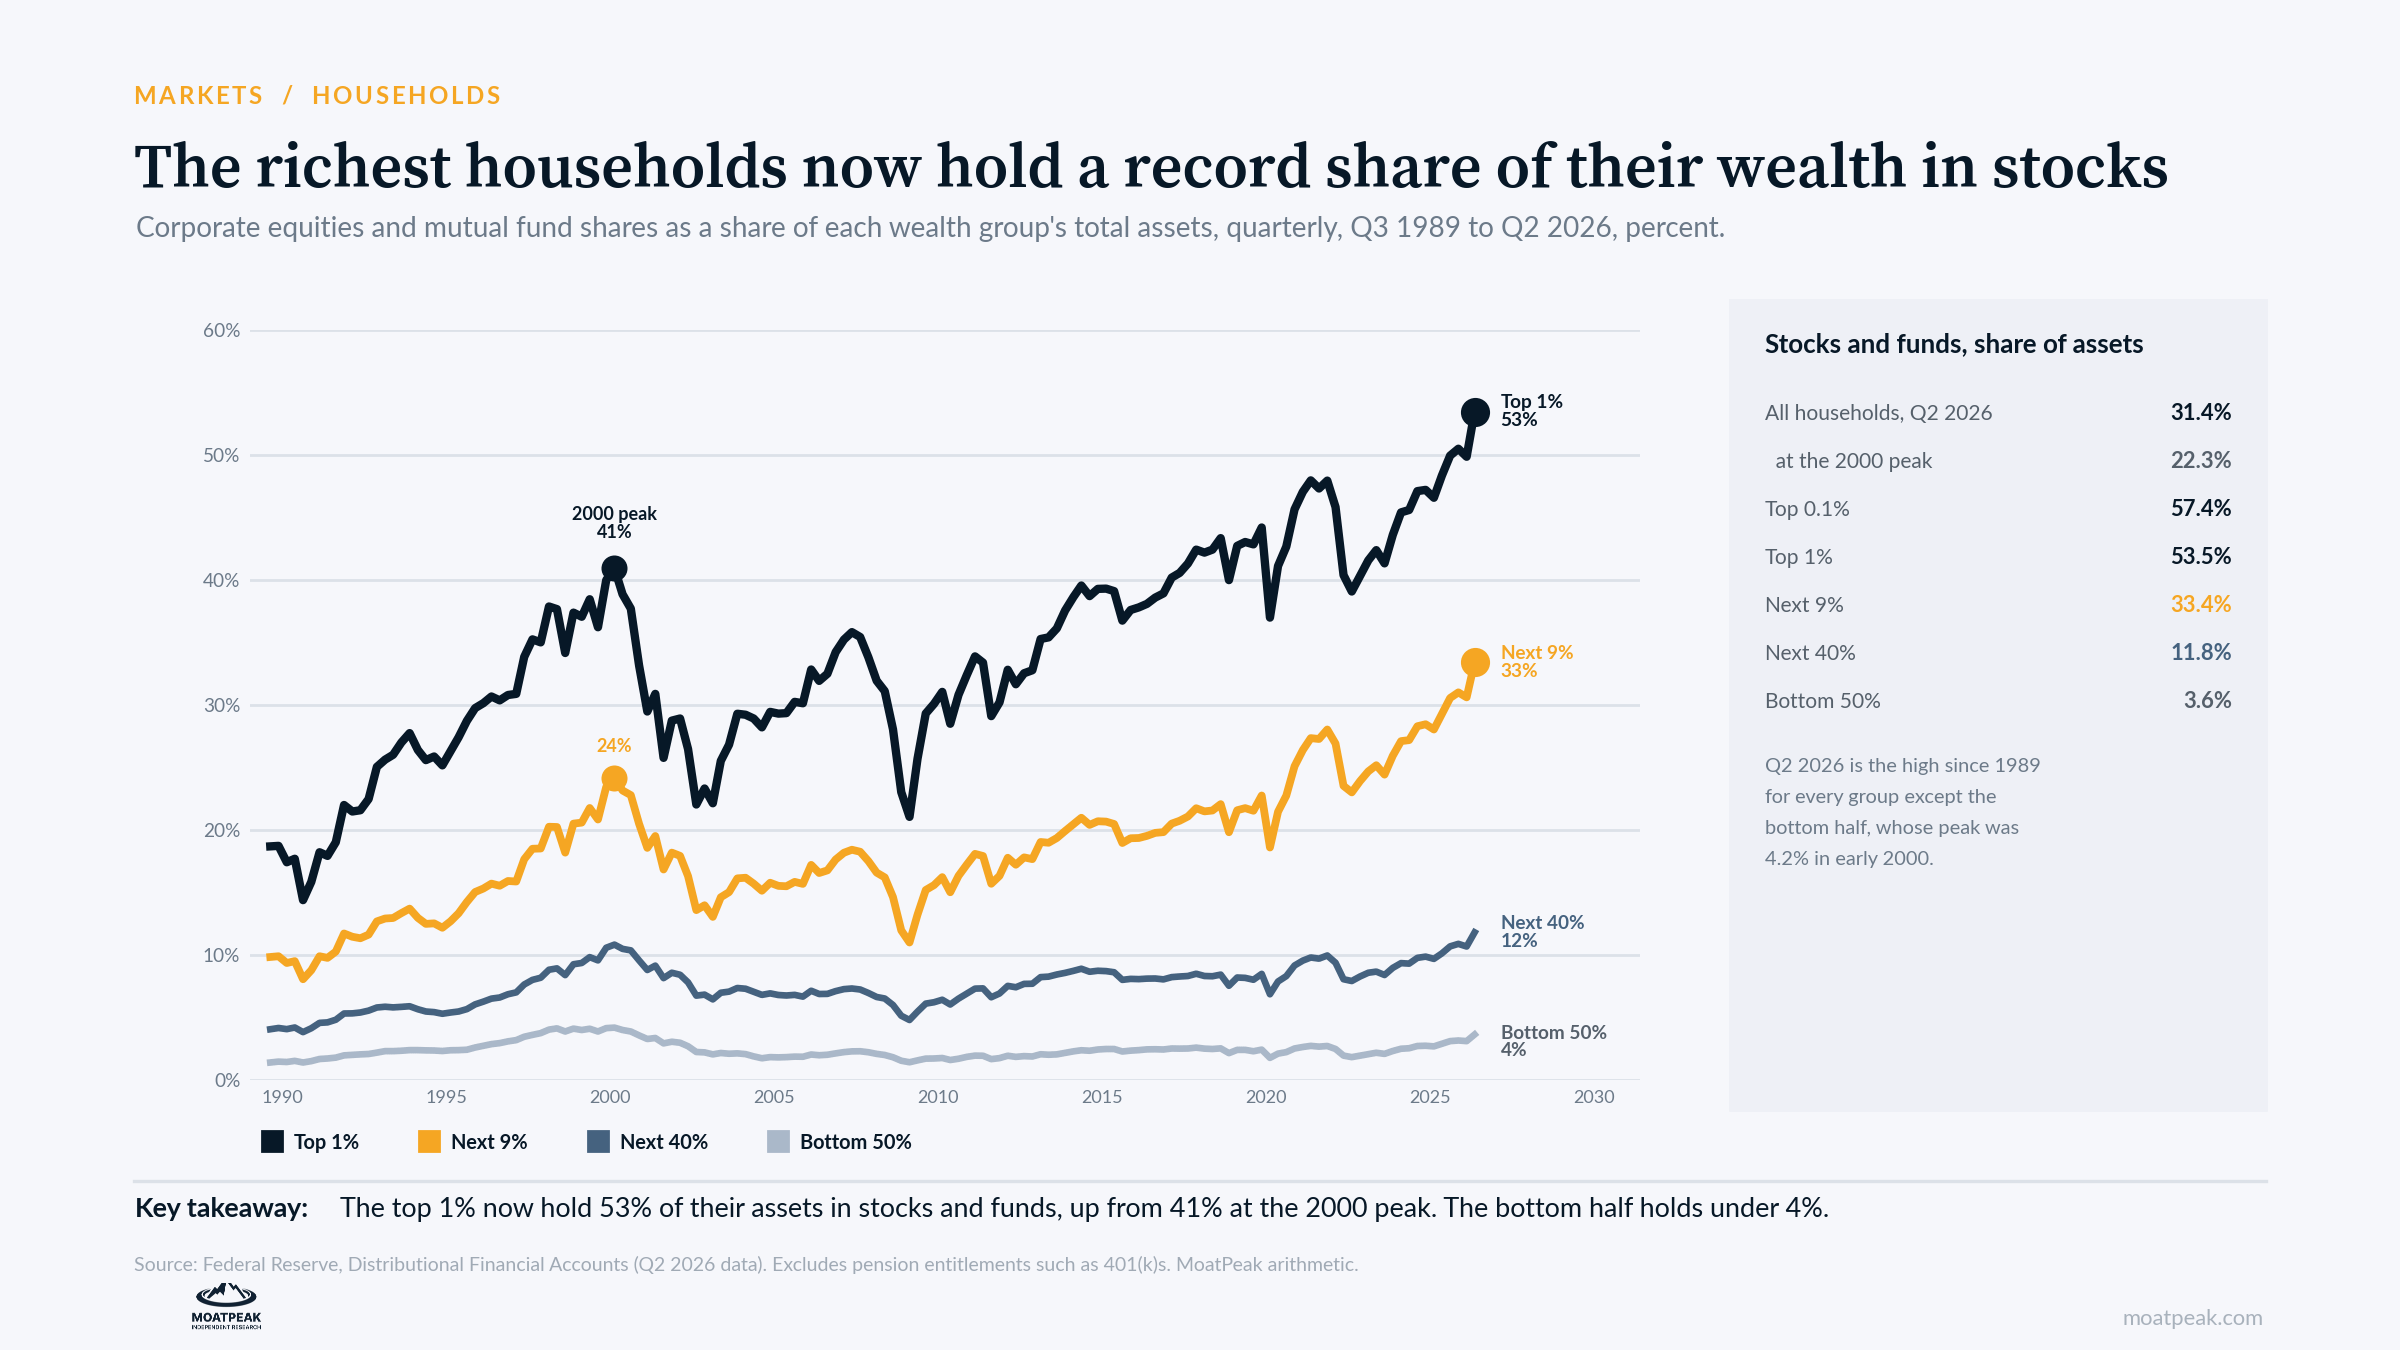
This month, much of the market talk has focused on small investors pulling back. The Federal Reserve’s latest wealth data tells a different story. At the end of June, stocks and mutual fund shares made up 31.4 percent of all household assets, the highest since the Fed began tracking this in 1989. At the 2000 peak, the share was 22.3 percent.
The record sits at the top. The richest 1 percent of households held 53.5 percent of their assets in stocks and funds, up from 41.0 percent in early 2000. The next 9 percent had 33.4 percent, up from 24.2 percent. The bottom half of households held just 3.6 percent, down from 4.2 percent in 2000.
Much of the jump came from rising prices. The S&P 500 rose 14.9 percent between 31 March and 30 June, and household holdings of stocks and funds grew from $55.2 trillion to $64.6 trillion in that quarter. Since then, the index has gained another 1.7 percent. On Friday, it closed at 7,623.68, 2.5 percent below its 6 October record.
Who owns the market
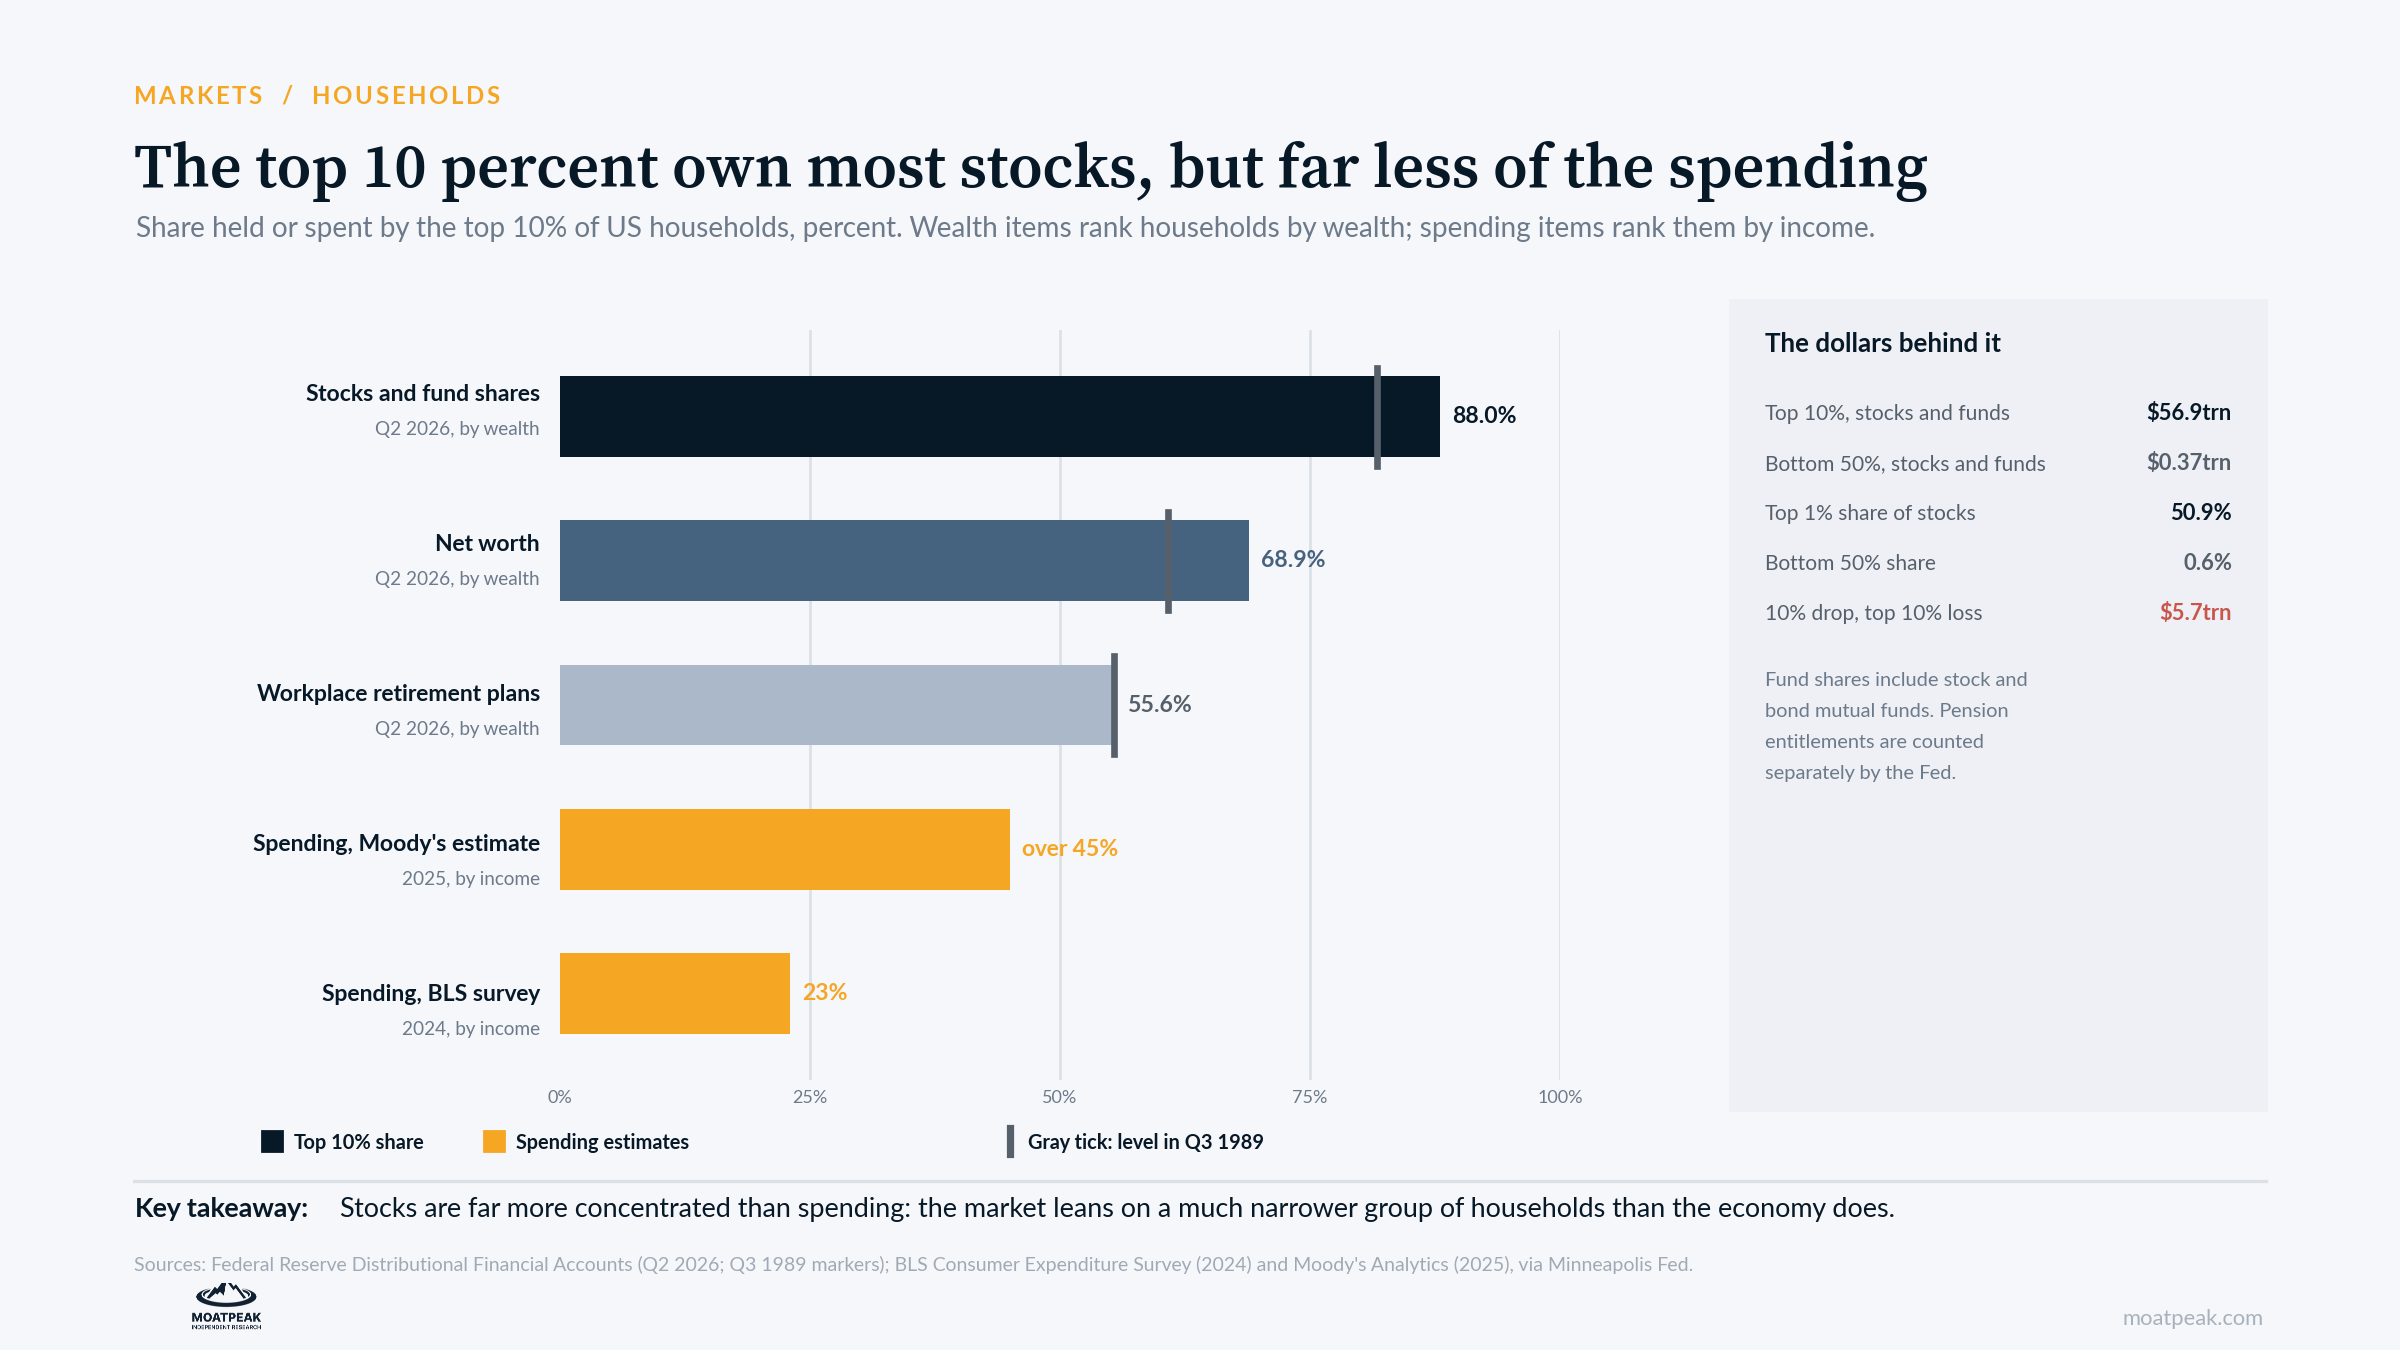
The top 10 percent of households by wealth own 88.0 percent of the stocks and fund shares held by households, worth $56.9 trillion. The top 1 percent alone own 50.9 percent. The bottom half owns just 0.6 percent, or about $370 billion.
This level of concentration is high but not new. The top 10 percent held 81.7 percent in 1989, and their share peaked at 88.4 percent in 2019. What has changed is how much of their own wealth the richest households now keep in stocks.
These figures exclude workplace retirement plans such as 401(k)s, which the Fed tracks separately and which are more widely spread. The top 10 percent hold 55.6 percent of those.
Spending is spread more widely still. The government’s Consumer Expenditure Survey says the top 10 percent of earners accounted for 23 percent of consumer spending in 2024. Moody’s Analytics puts it at more than 45 percent for 2025. These estimates rank households by income, not wealth, so the comparison is rough. Even the higher estimate is about half of the top 10 percent’s share of stocks.
Bonds are bidding for the same money
For most of the past 15 years, the richest households had few good alternatives to stocks. That changed this fall. The 10-year Treasury yield closed at 5.31 percent on 5 October, its highest since May 2002, and stood at 5.00 percent on Friday. Before September, it had not closed at 5 percent or higher since July 2007.
At the same time, the S&P 500 trades at 18.7 times expected earnings, according to FactSet. That means an earnings yield of about 5.3 percent, roughly 0.35 percentage point above the 10-year Treasury. For taxable investors, Treasury interest is also exempt from state and local income tax.
Our read
Among households, the top 10 percent are the buyers who matter, and they already hold more of their wealth in stocks than at any point in the Fed’s data. Much of that record came from rising prices rather than new buying, so there is less room to add. With 10-year Treasuries near 5 percent, the case for trimming is stronger than it has been in almost two decades.
That does not mean a sell-off is certain. It makes the market more sensitive to bond yields than to retail flows. Lower yields would ease the pressure on the richest portfolios, while yields near 5 percent would keep that pressure on.
The case against us
Wealthy households rarely sell large amounts at once. Many have held their shares for a long time, and selling would trigger capital gains taxes. That discourages large-scale rebalancing.
High allocations can last for years. The top 1 percent’s stock share rose for most of the decade after 2012, despite setbacks in 2015, 2018 and 2020.
Earnings are also helping. FactSet reports a blended growth rate of 29.5 percent for third-quarter earnings, and strong profit growth can support stock prices even when bonds offer higher yields.
What it means for your money
Pay more attention to the 10-year yield than to retail flows. For the households that own most stocks, Treasuries near 5 percent are a real alternative.
Review your own mix. Rising prices can push your stock share above your target even if you have not made a single trade.
Remember that the wealth effect works both ways. Gains at the top support spending by the richest households, and a downturn would hit those same households first.
What we are watching
Wednesday 28 October: the Fed’s rate decision and what it signals about December.
Thursday 29 October: third-quarter GDP and September personal income and spending.
Thursday 10 December: the Fed’s next Financial Accounts release, with third-quarter household balance sheets.
Educational research only. Not personalized investment advice. MB “MoatPeak Group”.