


Last week, the American stock market hit a new record. The S&P 500 rose 3.58%, marking its strongest week since April.
Everyone is giving the same explanation. On Friday morning, weak labor data came out. Payrolls dropped by 23,000. Fewer jobs make it less likely the central bank will raise interest rates, and lower chances of a rate hike are good for stocks. Bad news turns into good news, and the market closes at a record.
It sounds like a neat story, but the timing does not add up.
Most of the week – 92% – was already over before the news came out.
Let’s look at what really happened, day by day.
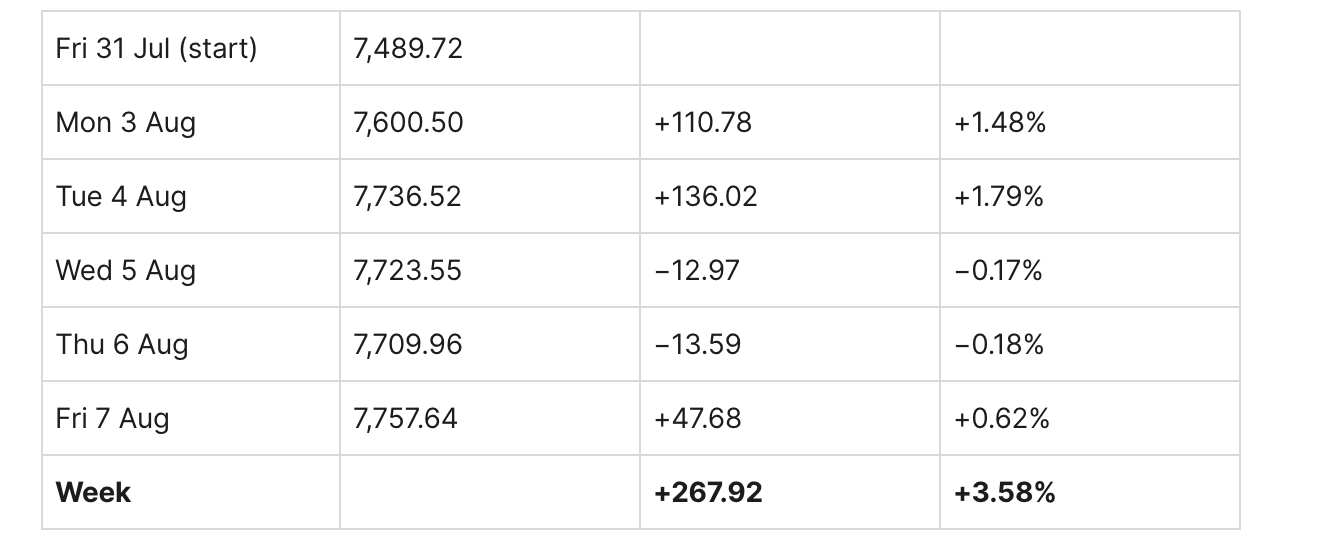
Monday and Tuesday added 246.80 points, which was 92% of the week’s total – before any labor data was released. Friday, the day getting all the credit, only added 47.68 points – about 18% of the week’s gain.
So what drove Monday and Tuesday? Two things, and neither was about interest rates. First, hopes for a shipping deal in the Strait of Hormuz pushed oil down more than 8% for the week. Second, earnings: Palantir reported after the close on Monday and its stock jumped nearly 40% over the week, thanks to a 63% free cash flow margin.
This is important, and not just a technical detail.
If you think the rally happened because of rate relief, you might expect more rate relief to keep the rally going, so you would hold your position until Wednesday’s inflation numbers. But if the rally was really about a shipping lane and two earnings reports, you are actually betting on a diplomatic negotiation that no one can predict, in a strait that has been mostly closed since February.
These are two very different investments. They just happened to give the same result this time.
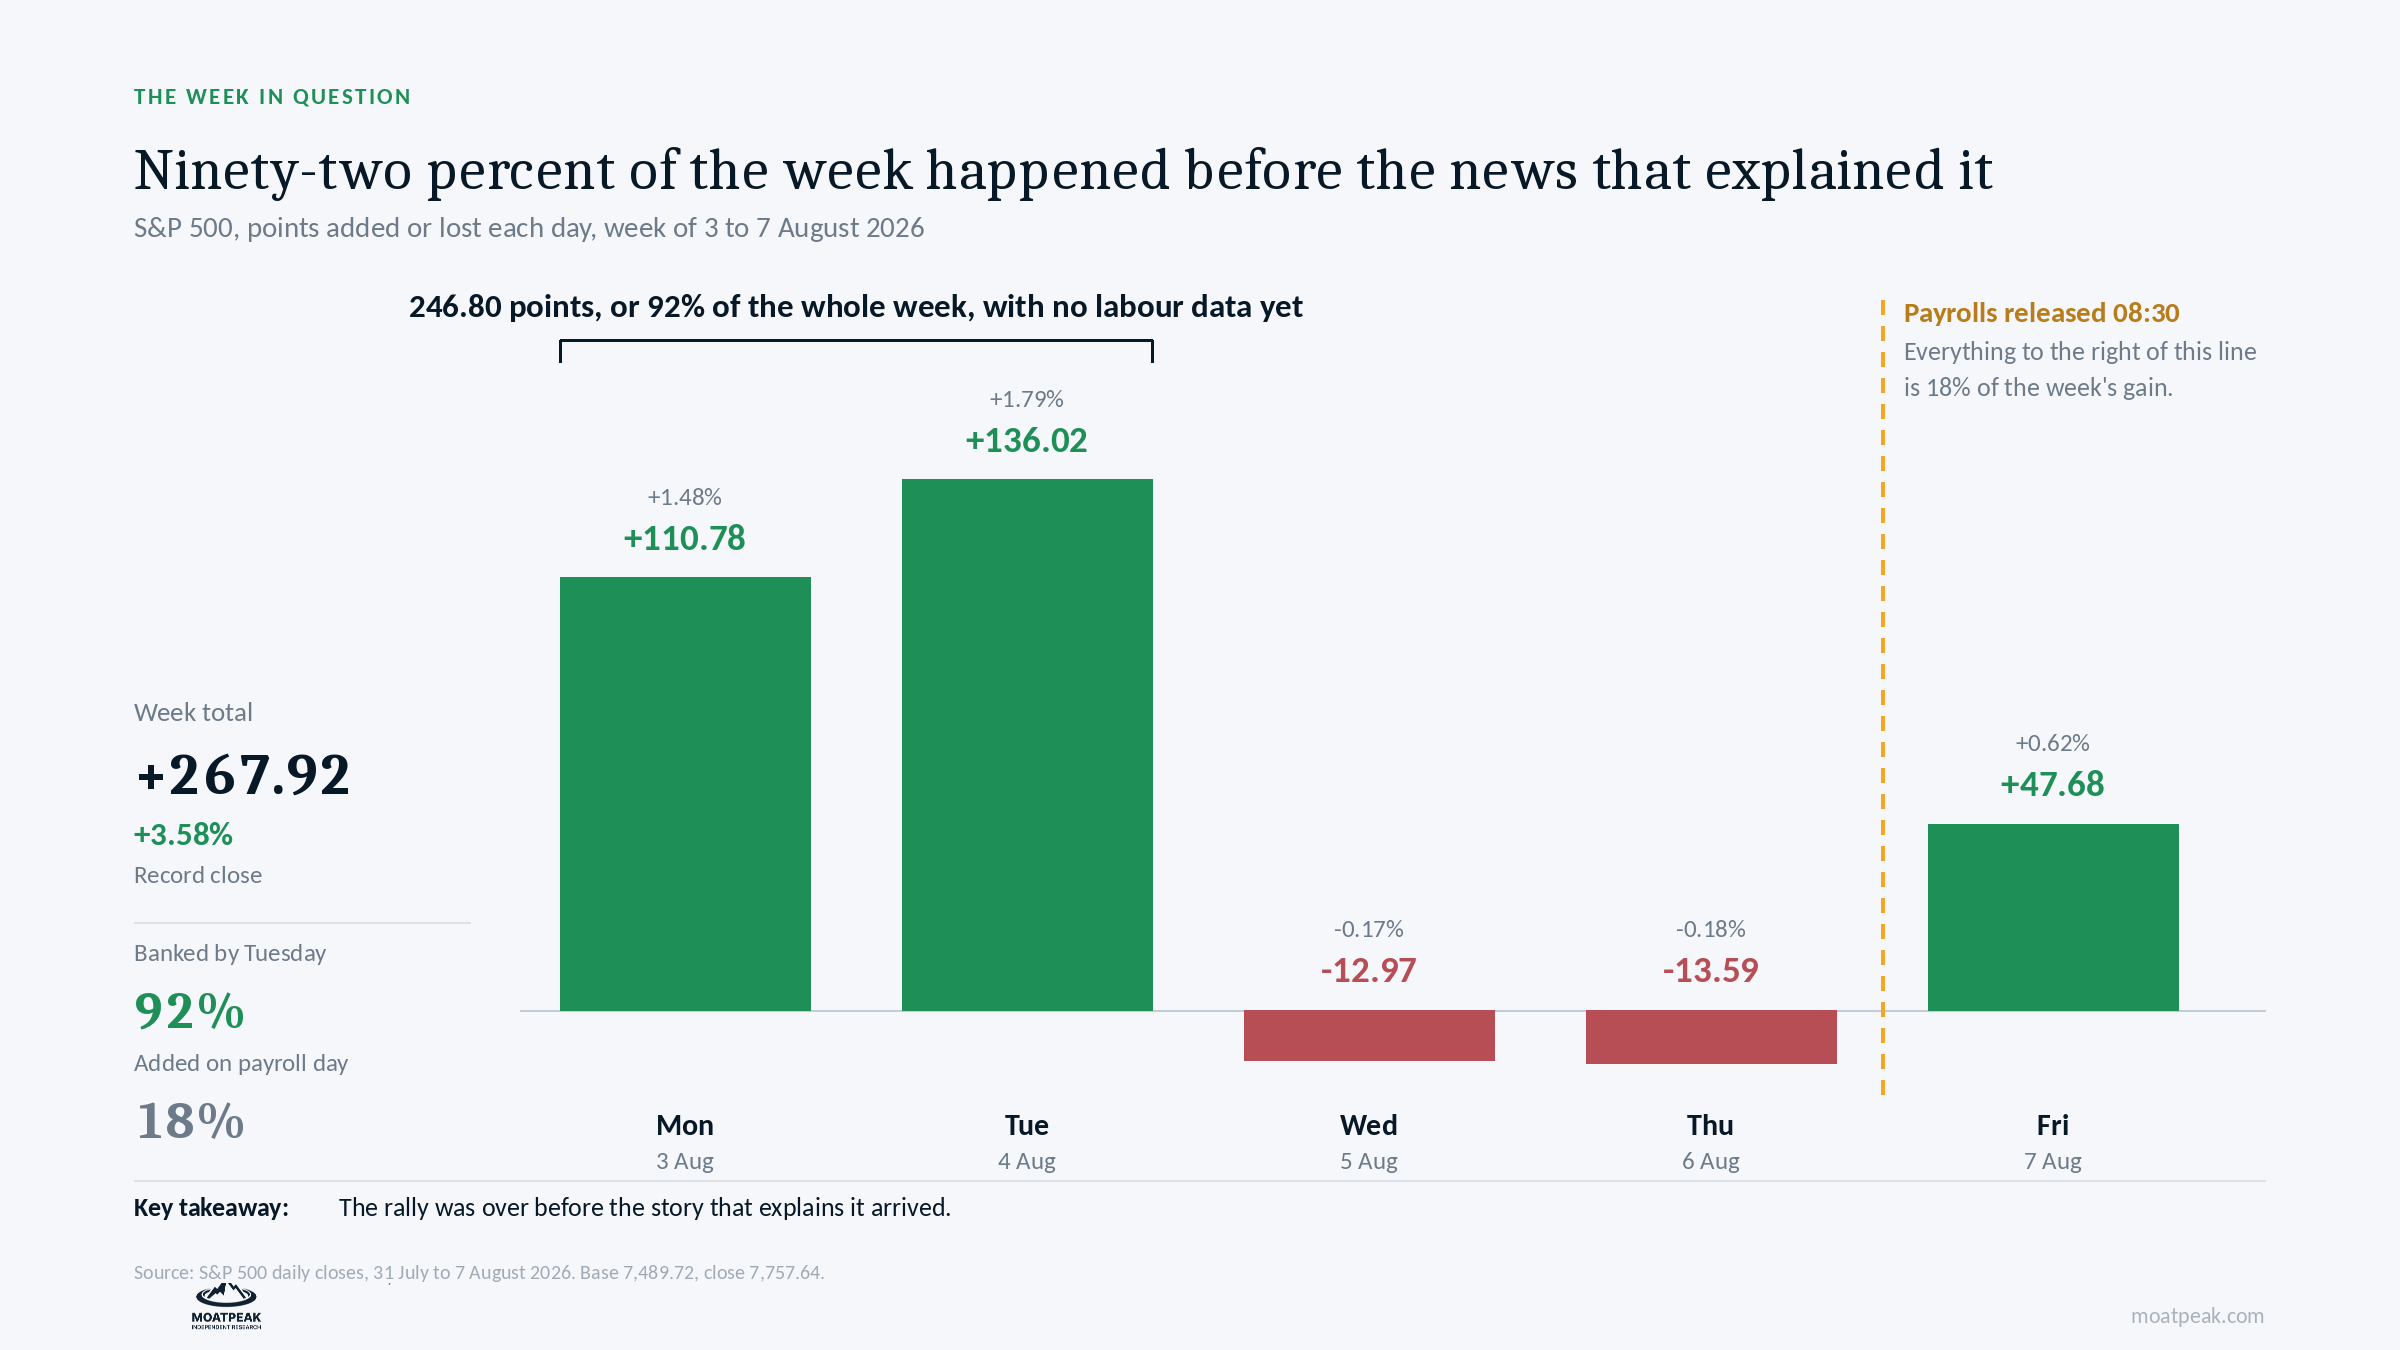
We date a move from its loudest moment, not its largest one.
Once you notice this pattern, you start seeing it everywhere. It becomes a quick test: change the starting point and see if the story still makes sense.
Here are three more examples from the same week where the story does not hold up.
Test one: Most of last week’s so-called disasters happened in just one bad afternoon.
Three companies were widely reported as having collapsed after their earnings reports.
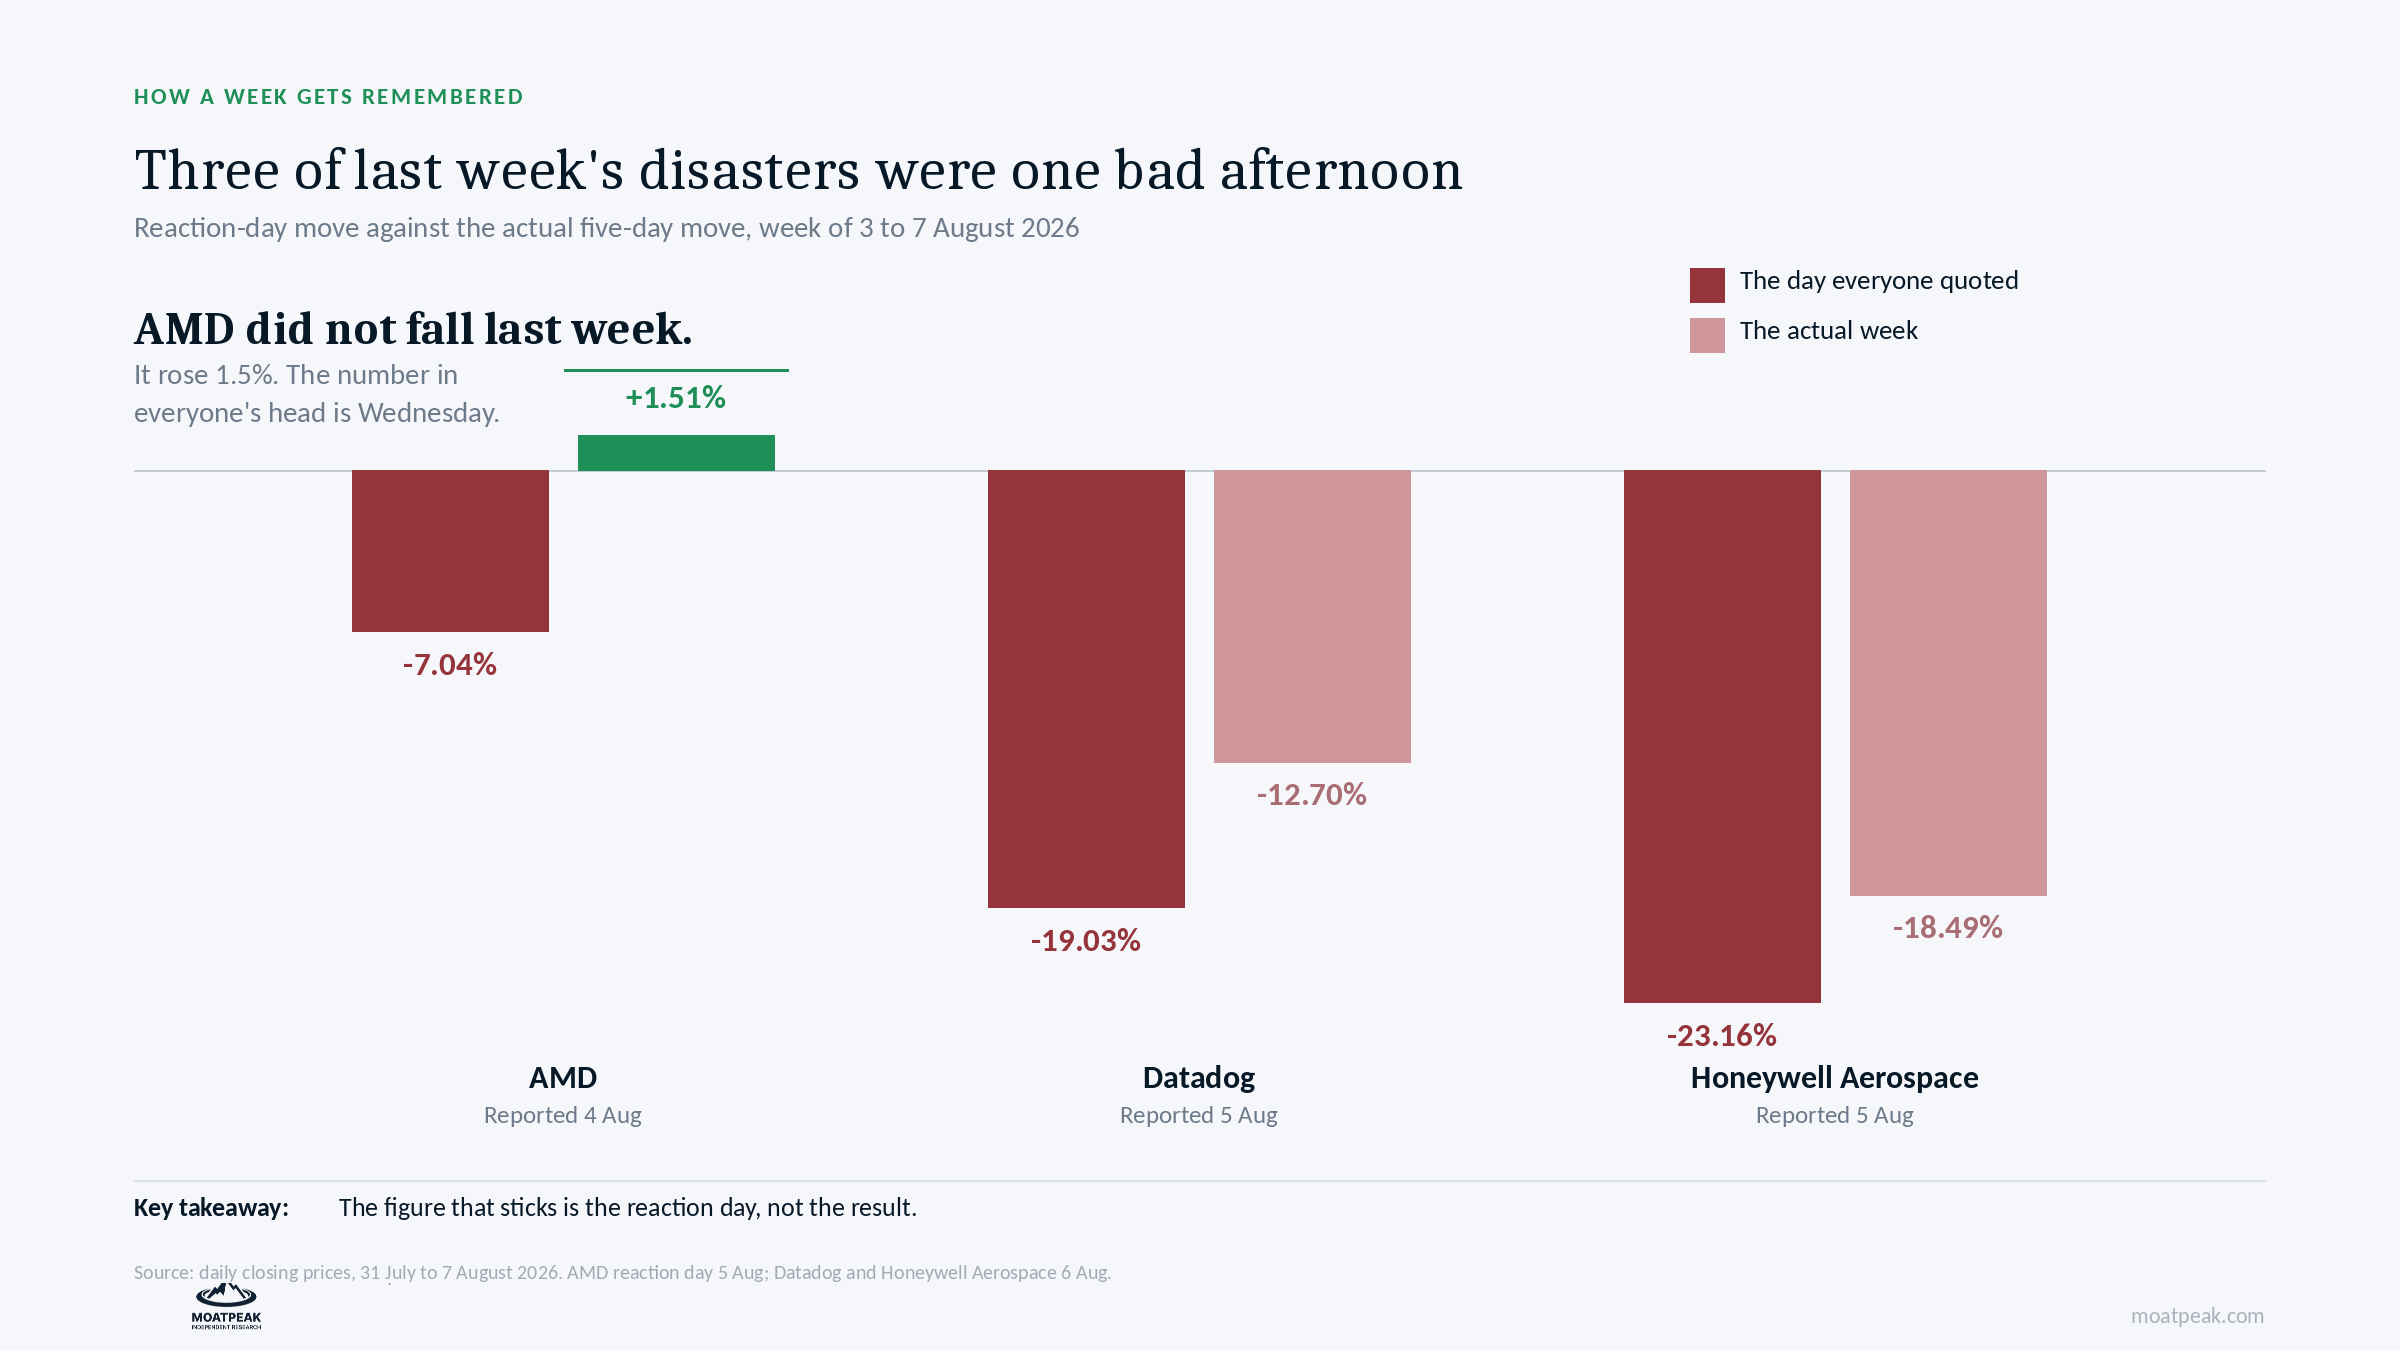
AMD “fell 7%”. That happened on Wednesday. But over the whole week, AMD actually rose 1.51%. The number people remember is from the reaction day, and it is misleading.
Datadog “fell 19%”. That was on Thursday. For the week, it was down 12.70%. Still a big drop, but about a third less than the headline number.
Honeywell Aerospace “fell 23%”. That was on Thursday. Over the week, it was down 18.49%. It is important to note this is HONA, the aerospace business that started trading separately on June 29. The parent company actually rose 1.30% that week. So, anyone who heard “Honeywell fell 23%” and owns Honeywell shares was thinking of the wrong company.
None of these numbers are made up. Each one is a real close-to-close move. They are just measured over a time frame picked for drama, not by the calendar.
Test two: The AI trade did not actually split by region.
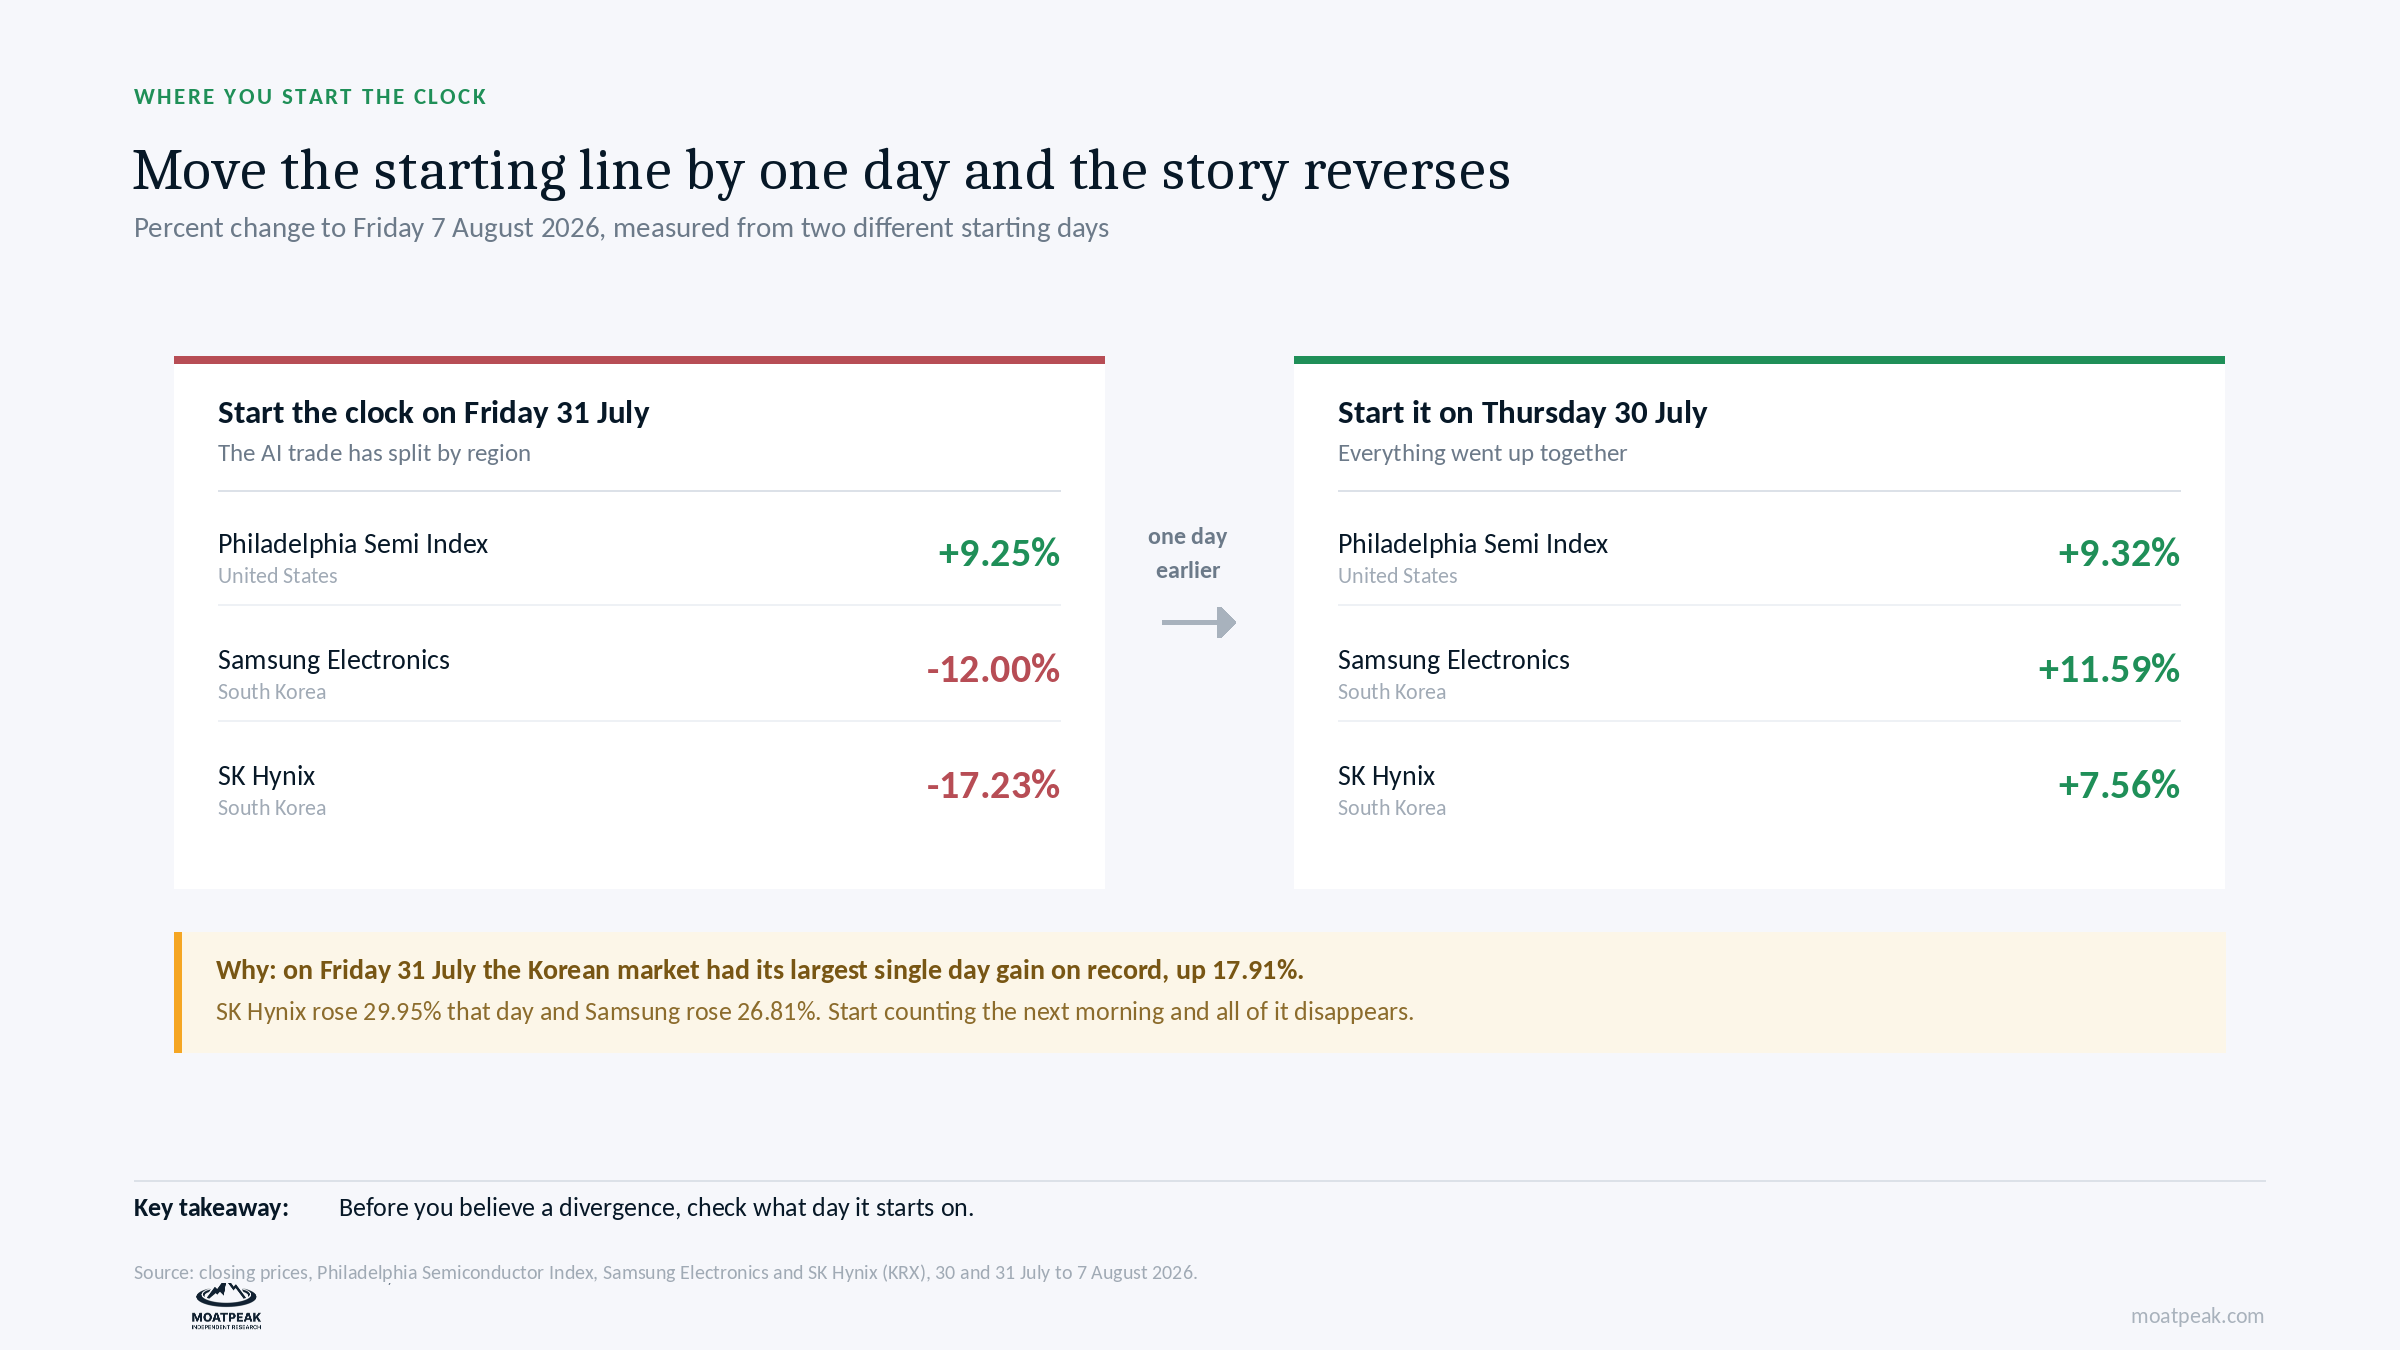
The most repeated market observation of the week was that artificial intelligence has stopped being a global trade and become a Western one. The evidence looked overwhelming. The American semiconductor index rose 9.25%. Samsung fell 12.00%. SK Hynix fell 17.23%.
That is a 26-point gap in just five sessions. Case closed, or so it seemed.
But if you shift the starting point by just one day, from Friday, July 31 to Thursday, July 30, the picture changes.
The American semiconductor index: +9.32%. Samsung: +11.59%. SK Hynix: +7.56%.
Everything went up.
That is because Friday, July 31, saw the biggest single-day gain in Korean market history, up 17.91%. SK Hynix jumped 29.95% that day, and Samsung rose 26.81%. If you start counting from Saturday morning, you are only measuring the pullback from a record high, not the record itself.
The regional divergence was real for exactly one choice of start date.
Test three: Let’s apply this to our own position.
It is always easier to spot mistakes in others, so let’s run the same test on one of our own positions.
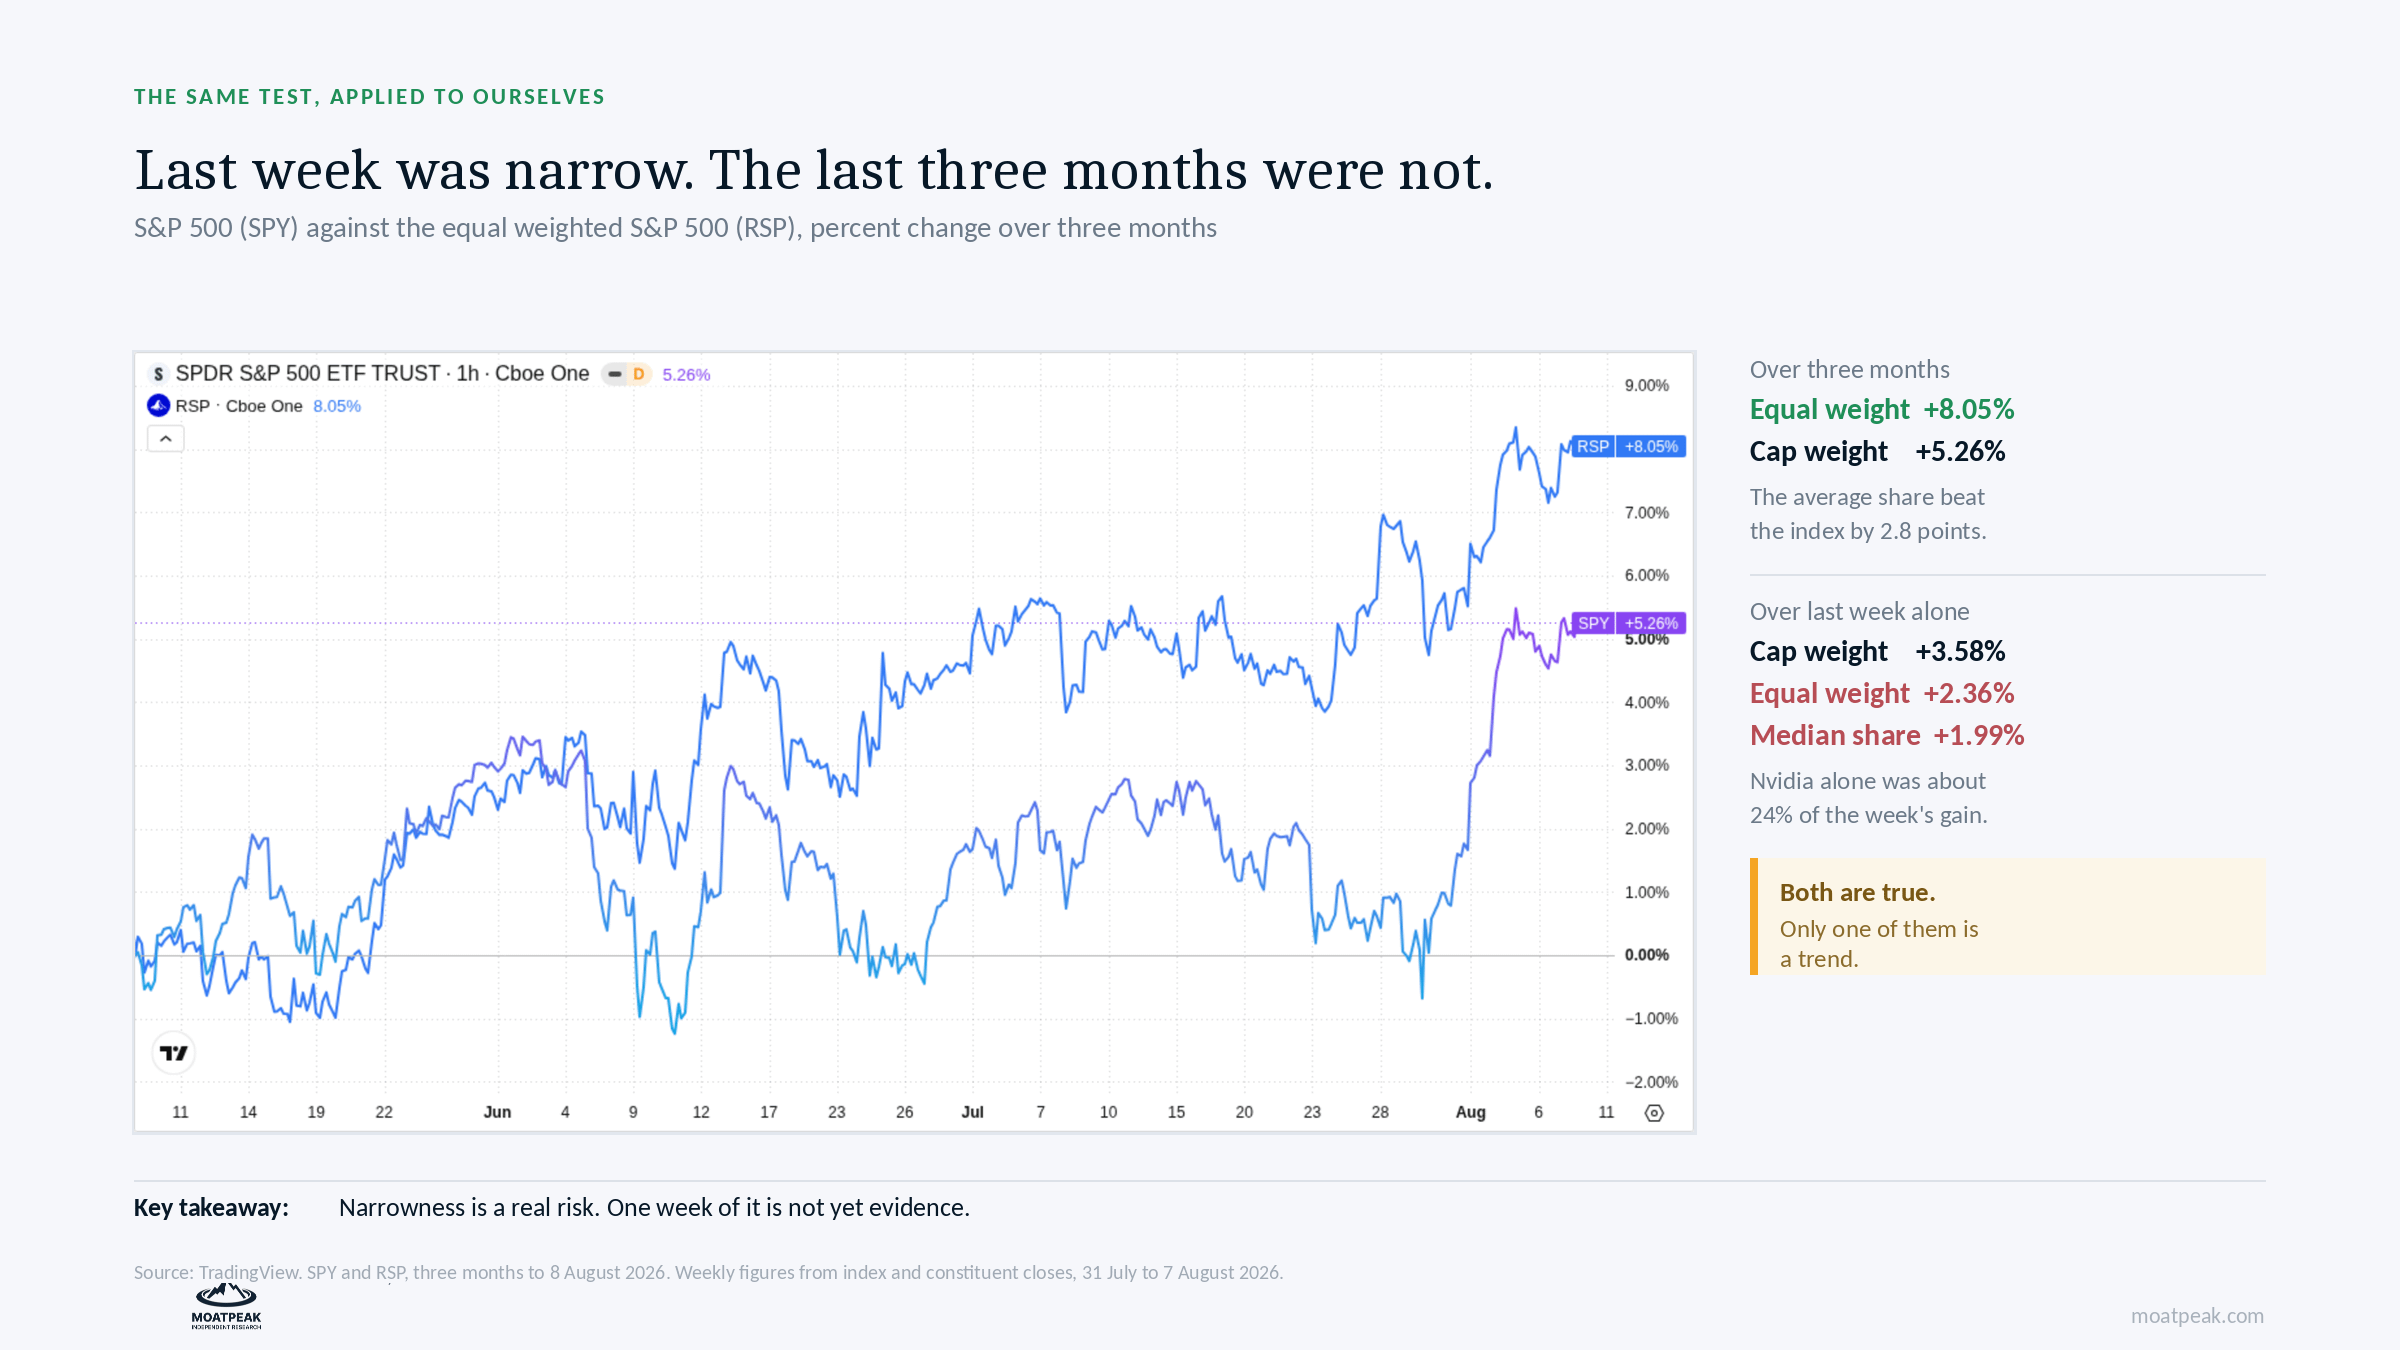
We have often said this market is dangerously narrow, and last week seemed to prove it. The index rose 3.58%. The equal-weighted version, where every company counts the same, rose 2.36%. The median stock was up 1.99%. Nvidia alone made up about a quarter of the index’s total gain.
By any measure, that is a narrow week.
But if you look back three months instead, the picture changes.
During that time, the equal-weighted index is up 8.05%, while the main index is up 5.26%. On average, smaller companies have outperformed the giants by almost three percentage points.
Both facts are true. Only one of them is a trend, and it is not the one that suits our argument. To be honest, last week was narrow, but the past three months were not. One week of narrow trading is something to watch, not something to draw big conclusions from. If it keeps happening, we will point it out again. We are not going to claim that five days make a new trend.egime.
The real new development was hidden inside a falling share price.
Amid all this, one truly new fact came out last week. It was buried in one of the misquoted numbers, which is probably why few people noticed.
On its earnings call, Datadog said its biggest customer – described only as a leading artificial intelligence company – had signed a nine-figure renewal, but with a usage reduction starting in the third quarter. The finance chief said this reduction is already included in their guidance.
Think about that for a moment. A major AI company reviewed its monitoring costs and decided to cut back.
For two years, everyone assumed AI workloads would only grow, and that selling to AI companies meant a one-way market. Now, a big customer is publicly choosing a different path. Not because the technology failed, but because it was too expensive and someone found a way to optimize costs.
To be fair, Datadog’s revenue actually grew faster, reaching 36% growth for the quarter. The company also said it now has more than 750 AI-native customers, and that group is still growing. The share price dropped because of the guidance and the risk of relying too much on one customer, not because the business had already declined.
But the direction of travel is the point. When capacity is scarce, you pay whatever it costs. When it stops being scarce, procurement gets involved. This is what the beginning of that looks like.
Two things that do not depend on where you start the clock
The first is about the central bank. On July 29, four days before the week started, the rate-setting committee voted 9 to 3 to keep rates at 3.50% to 3.75%. All three dissenters wanted to raise rates.
Sit with that. The market spent last week celebrating that a September rate rise had become less likely. Three of the twelve voters had wanted one immediately, days earlier. The odds of a September hike did fall hard over the week, from roughly two-thirds on Monday to about 40% on Friday. But the conversation in that room is still about whether to go up. Nobody is discussing cuts.
The second point is about workers’ share of national output. In the second quarter, it was 52.9% – the lowest since records began in 1947. Real hourly pay also fell at a 3.1% annual rate during the same period.
This fact does not depend on when you start measuring, because it is not about change. It is a level, and it is the lowest ever recorded.
Companies are protecting their profit margins, and they are doing it at the expense of household income. This helps profits – until it starts to affect what households can spend. Retail sales numbers come out on Friday.
What we are keeping an eye on this week
Taiwan Semiconductor reports July revenue on Monday, giving us the first monthly look at the AI supply chain since Asian chip stocks dropped. U.S. inflation data comes out Wednesday morning, and that is the main event: if it is above 3.6%, talk of rate hikes will return. Retail sales are out on Friday and will show if the record-low labor share is affecting spending yet.
And a suggestion you can use on any market story you read this week, ours included. Before you accept an explanation for a price move, check when the move happened and when the explanation happened. If the explanation arrived second, it is a story about the story.
Our comprehensive weekly research, including what we think holds Tuesday’s highs and the level that would change our mind, is at moatpeak.com.
Educational research only. Not personalized investment advice. MB “MoatPeak Group”.