


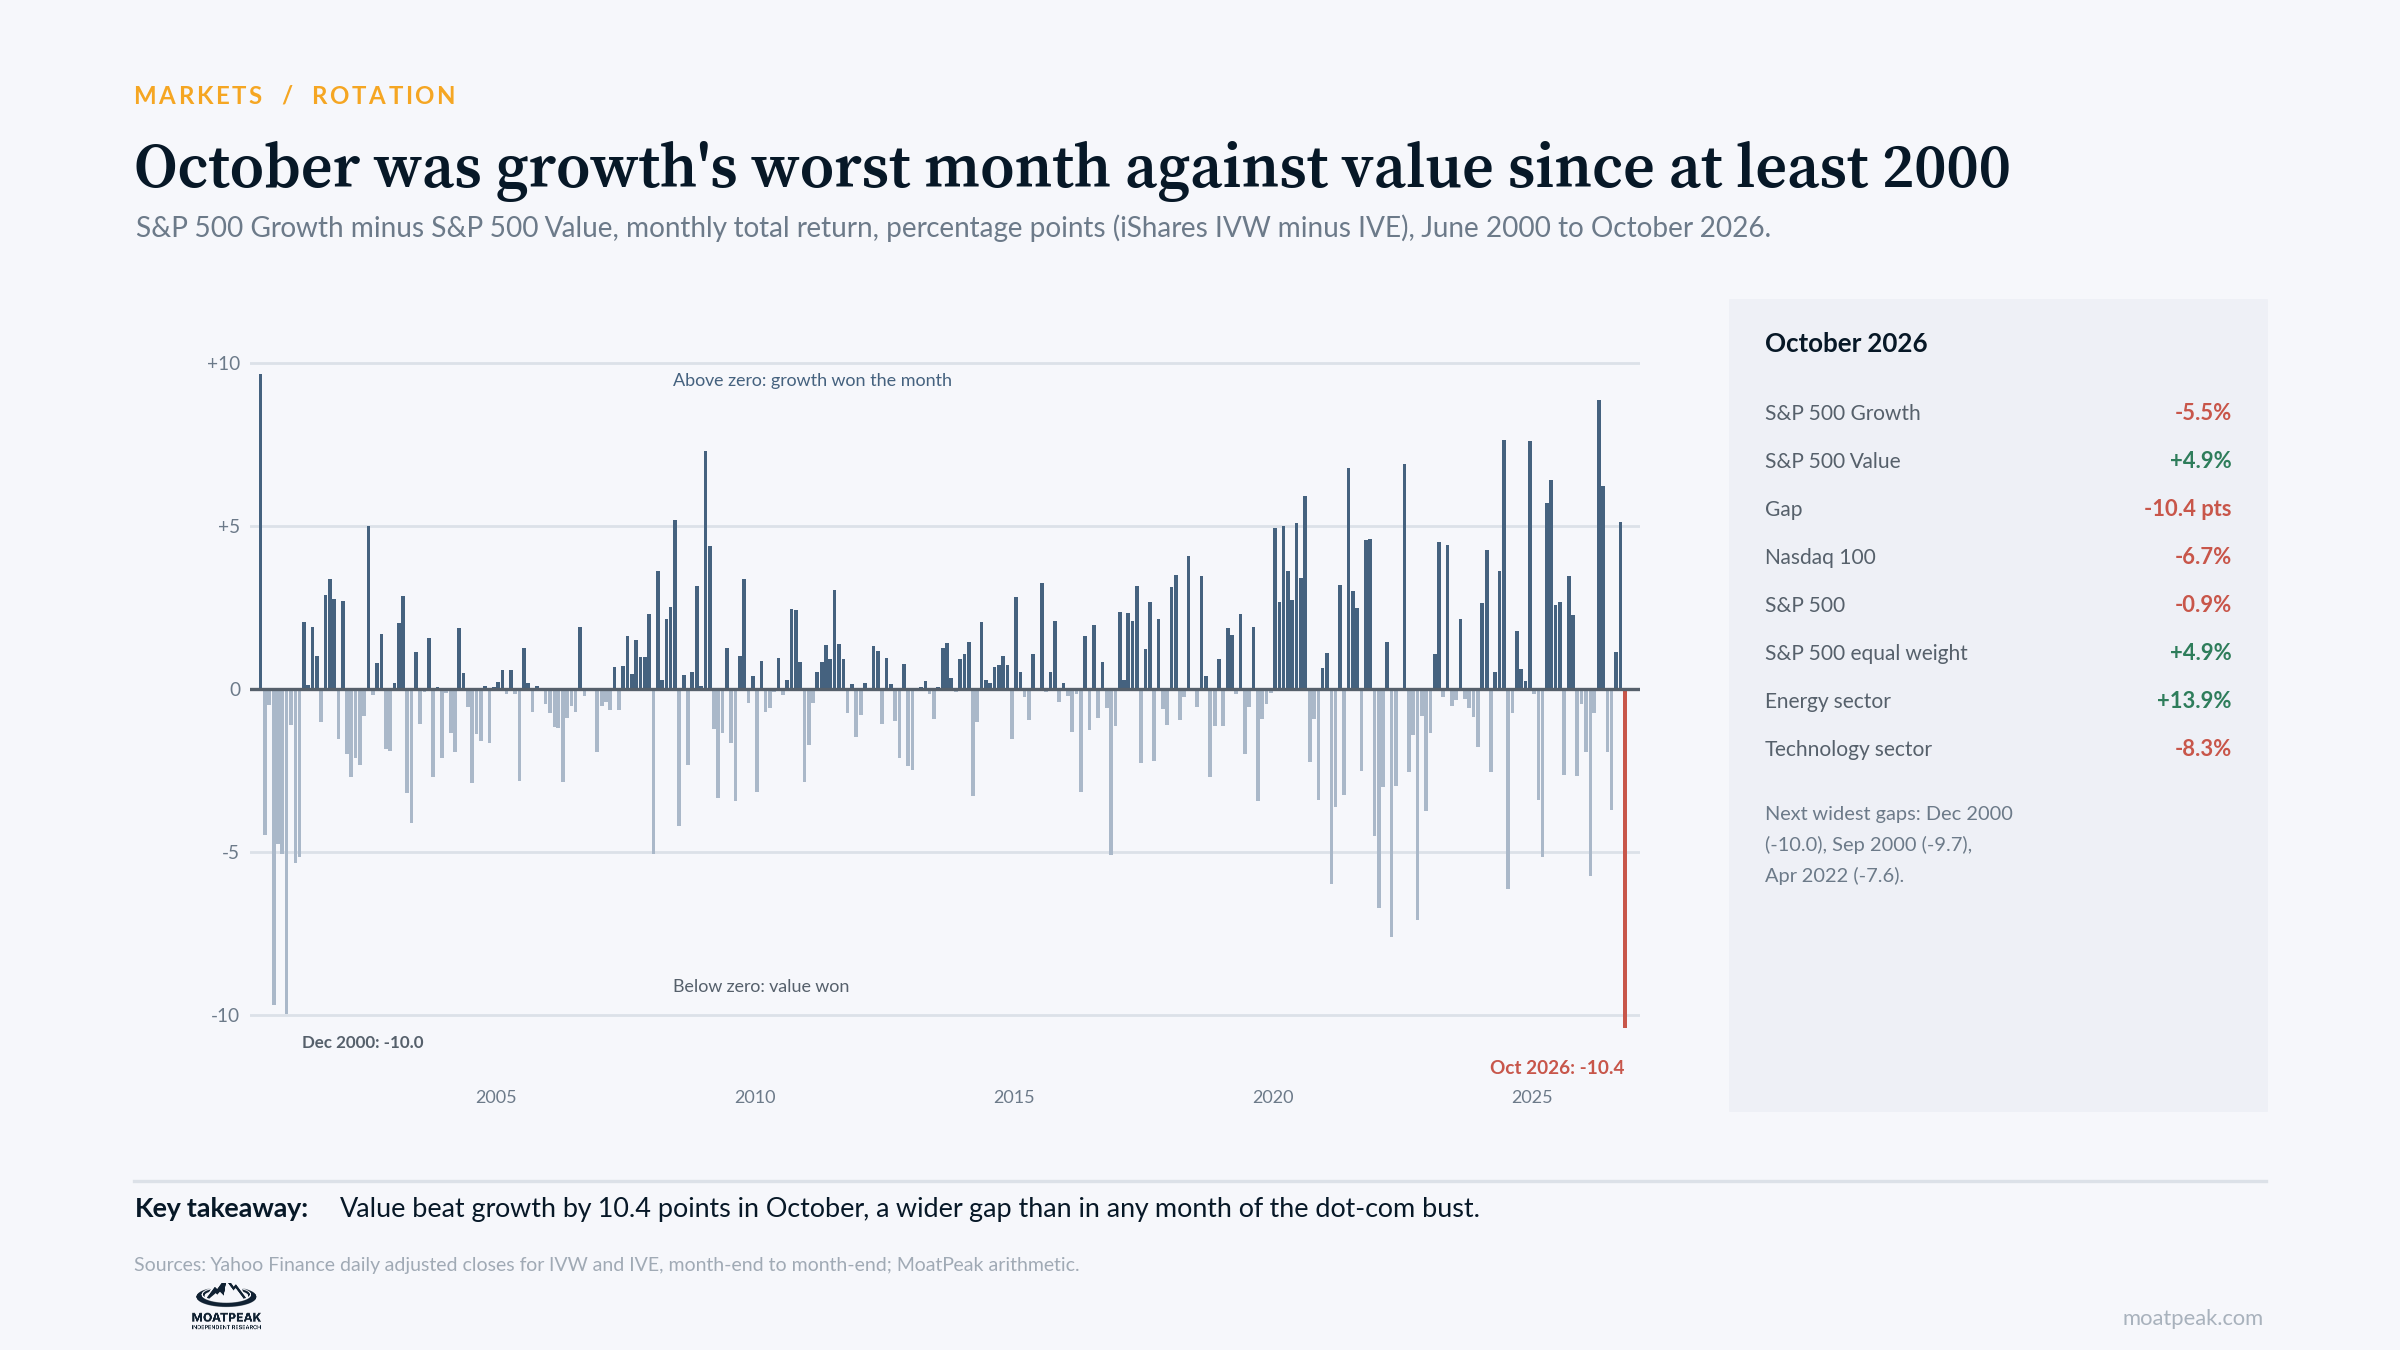
The S&P 500 lost 0.9 percent in October. The average stock in it gained 4.9 percent.
This gap sums up the month. The index’s value stocks returned 4.9 percent, and its growth stocks lost 5.5 percent, a difference of 10.4 percentage points. In the data for the two halves of the index, which goes back to June 2000, no month comes close except two from the dot-com bust: December 2000 at 10.0 points and September 2000 at 9.7. The Nasdaq 100 fell 6.7 percent and trailed the equal-weighted S&P 500 by 11.6 points, the widest gap since the equal-weight fund launched in 2003.
Investors shifted money into the overlooked parts of the market. Energy stocks returned 13.9 percent, consumer staples 10.9 percent, utilities 10.1 percent and health care 9.8 percent. Technology lost 8.3 percent, communication services 10.0 percent and semiconductors 14.2 percent.
What happened after the last 10
A record month invites a simple conclusion: the rotation has started, so follow it. We checked what the record says about that.
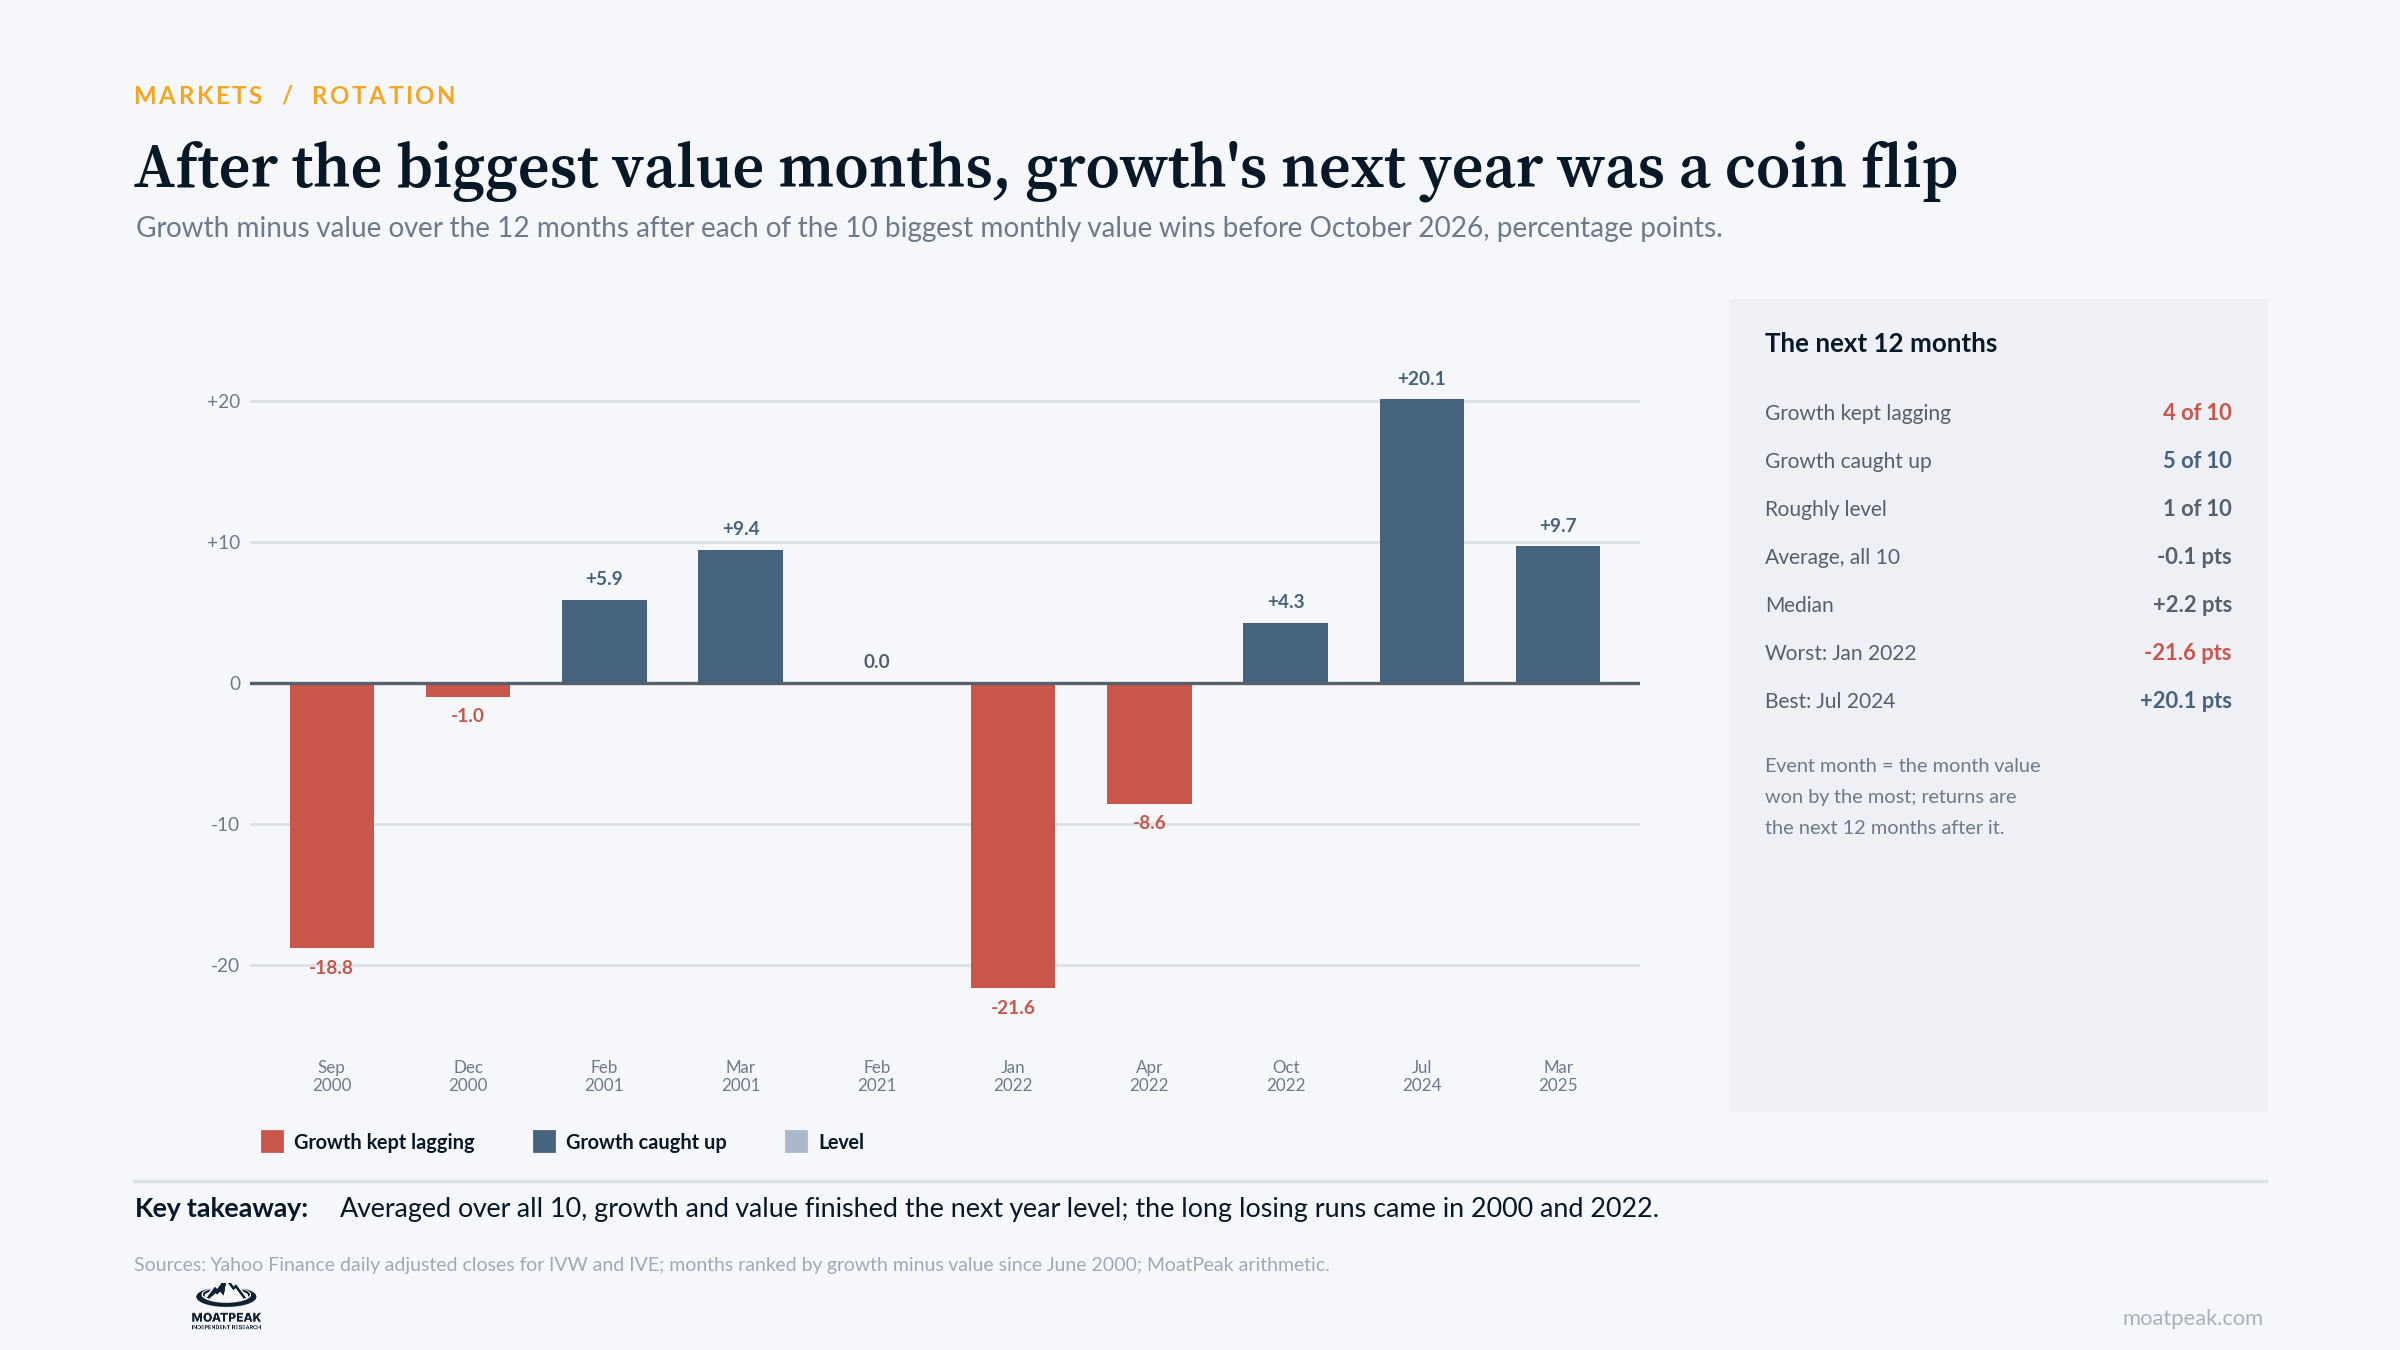
We took the 10 biggest monthly wins for value over growth before October and measured the next 12 months. Growth kept lagging after four of them: September 2000, December 2000, January 2022 and April 2022. It caught up after five: February 2001, March 2001, October 2022, July 2024 and March 2025. After February 2021, the two finished level. Averaged across all 10, the gap over the following year was minus 0.1 points, which is to say essentially nothing at all.
The latest example shows why you shouldn’t read too much into a single month. In February of this year, value won by 5.7 points. Over the next three months, growth beat value by 14.5 points.
What separated the two groups
Growth’s long losing runs came when the cost of money changed for the companies that had led. In 2000, the funding window for young technology companies closed, and many of them could no longer pay for their plans. In 2022, the Fed began raising rates at the fastest pace in four decades, and the value of distant profits fell with it.
The rotations that reversed happened in calmer times. In July 2024 and March 2025, investors sold the leaders in a hurry, but their earnings kept growing and they still paid for their spending out of their own cash. Growth was back on top within months.
Our read
This October has one feature in common with the first group. The largest growth companies now pay for their spending with borrowed money. As we wrote on Saturday, Amazon, Microsoft and Alphabet spent $166.6 billion on capital projects in the September quarter, more than the $142.7 billion of cash their businesses generated, and their combined long-term debt has tripled in a year. That changes the cost of money for the leaders themselves, which is what drove the rotations that lasted.
It does not make this 2000. The leaders still earn enormous profits, and most of their customers are paying. We read October as a rotation with a reason behind it, which is different from a panic that will fade on its own. That is a reason to take it seriously. It is not a forecast of where growth stocks will be in a year, and the record says nobody should pretend to have one.
The case against us
The base rate cuts both ways. Half the time, growth caught up within a year, and the best rebound came only two years ago, when growth beat value by 20.1 points in the 12 months after July 2024.
Value is no longer cheap either. Staples, utilities and health care each gained around 10 percent in a month, which is a lot for sectors bought for their safety. After a month like that, some of October’s winners are priced for more good news.
Borrowing to build is not a sign of distress by itself. Microsoft can borrow close to the rate the US Treasury pays, and if the new data centers earn more than their cost, the debt will look cheap in hindsight.
What it means for your money
Know what your index owns. If your core holding is an S&P 500 or Nasdaq fund, October showed how much your results depend on a handful of companies. An equal-weight or value fund behaves very differently.
Rebalance instead of chasing. A record month is a good moment to check your mix against your plan. Moving everything into last month’s winners is a bet the record does not support.
Watch the funding. The signal that would turn this into a 2000 or 2022 is the cost of money for the leaders: their bond spreads, their capital spending plans and whether they keep issuing debt.
What we are watching
Wednesday 4 November: the Treasury’s quarterly refunding announcement.
Friday 6 November: the October jobs report.
Later in November: Nvidia’s results, the next test of whether AI spending is still growing.
Educational research only. Not personalized investment advice. MB “MoatPeak Group”.
The base rate is thinner than ten observations suggests: seven of the ten months fall inside two episodes (Sept 2000–Mar 2001 and Jan–Oct 2022), so it's closer to five independent observations. Within those episodes the result flips depending on the starting month, which says more about entry timing than direction. Did you test the 12-month outcome by episode rather than by month?
Your funding signal is the cleanest test in the piece. If the leaders keep borrowing near the Treasury rate, this stays a valuation rotation; if their spreads start widening toward CoreWeave's 15%, it becomes a 2022 funding argument. Friday's tape already showed the split in the open: energy up 13.9% for October while semiconductors fell 14.2%. One question on the base rate: in the five cases where growth caught up within a year, did the leaders still have expanding margins at the time, or were they already borrowing to defend growth? That seems like the line between a rotation that reverses and one that compounds.