


Before bringing it to the readers’ attention, we verified it against all the definitions that a reader might anticipate.
The index is still reaching new records, but the individual stocks make no such gains. That is the true story of this week.
On Monday, the Nasdaq climbed 2.26 percent to 27,122.09, making it the twenty-first time in 2026 that the index had set a record, the first such occasion since June 2 and also its largest single-day increase in seven weeks; on Tuesday it gained an additional 0.45 percent to reach its twenty-second record close. Meanwhile, the S&P 500 finished Tuesday without any change.
On Tuesday the stock reached $345.34 during the day, momentarily exceeding a market capitalisation of five trillion dollars, but ended the day at $339.75, giving it a market value of $4.96 trillion. It has risen 7.2 percent this month and 25 percent this year. The only company that has ever closed above five trillion dollars was not Apple.
All the previous points can be verified. The statistic which everybody keeps repeating now comes into play.
The claim, and why we did not simply publish it
It has been claimed that when the bank index is more than ten percent below its most recent peak whereas the general index is within one percent of its own peak, this situation last occurred in January 2000.
It’s an excellent line, but it entirely depends on two points which nobody mentions: which bank index and which high.
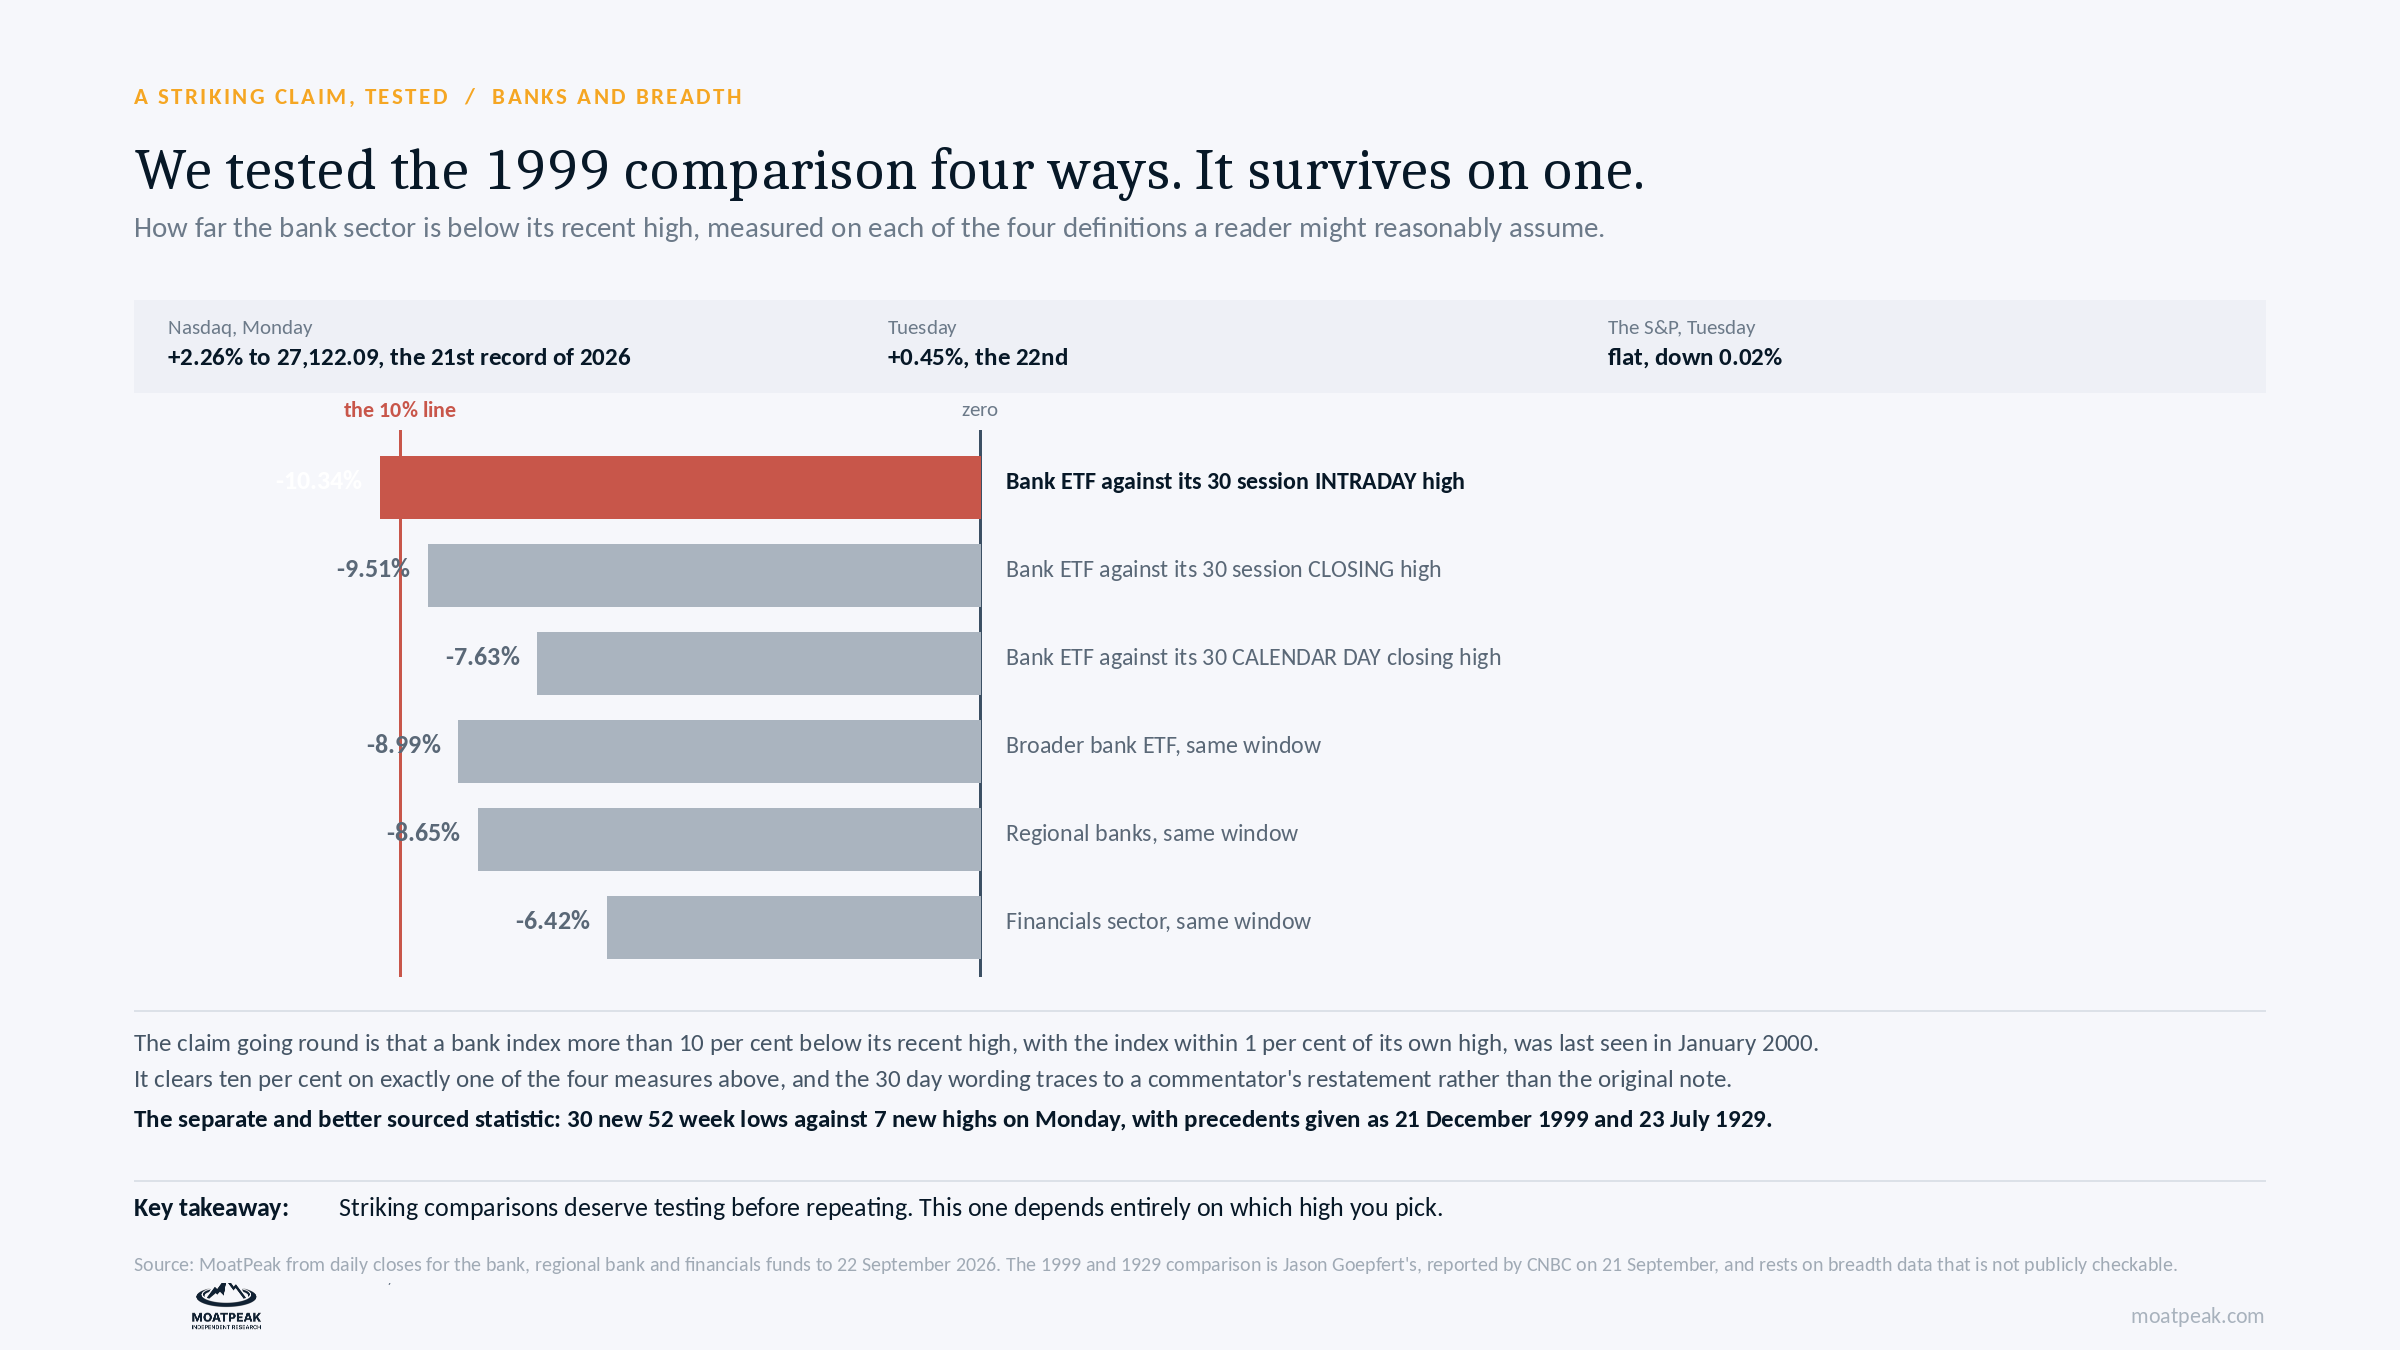
We therefore tried it in four different ways, using the daily closing prices of funds that an ordinary investor could purchase.
When compared with the bank fund’s highest intraday price over the past thirty sessions, its price is 10.34 percent lower. This lends support to the claim. Against its highest closing price over the same thirty sessions, however, it is 9.51 percent lower. The claim then fails.
It is 7.63 percent lower when compared with its highest closing price over the past thirty calendar days. This is much less than had been claimed.
When the same period’s figures for the overall bank fund, the regional bank fund, and the financials sector fund are examined, the figures show drops of 8.99, 8.65, and 6.42 percent respectively. None of these contradict the claim.
Of the six measures, only one shows a fall of over ten percent, and that is the one that compares today’s closing price with an intraday spike from five weeks ago. That is the most favourable comparison that could possibly be made.
Where the wording came from
There’s one more matter, and it concerns attribution, not arithmetic.
The initial observation is from a note written by a technical strategist and has been reported in two publications; one states that it is “more than ten percent below a recent high” while the other says that it is “more than ten percent below its thirty-day peak“.
The thirty-day version—this is the one currently being distributed—appears in just one of the articles, in the section headed ‘Summary’ by that author. We were unable to access the original institutional note.
It is possible that the exact phrasing which people are repeating was not actually what the analyst said at the time. Moreover, the comparison for January 2000 requires index data from the 1990s, which is behind a paywall and not freely available.
The version that does hold up
There is also a statistic from that same week which is better supported and so one that we should rely on.
On Monday the index increased by more than one percent and thus reached a point which was just one percent away from a record, even though thirty of its components hit new 52-week lows and only seven reached new highs. The analyst who drew this comparison identified only two instances like it: 21st December 1999 and 23rd July 1929.
Two points should be noted. The first is that the source is attributed to a particular individual who published it himself, and the dates given are specific rather than merely referring to a general month. Nevertheless, it depends on breadth data extending back to 1928, which can only be verified by firms that have a license.
We include it alongside his name and the qualification, even though that does not present it as a confirmed fact.
What we actually think this means
The fact that neither of the statistics is considered makes the basic situation obvious and fully interesting without the need for a reference to 1929.
The semiconductor index is 13.3 percent lower than its level in June. The bank fund fell by 2.33 percent on Tuesday. The difference between the two-year and ten-year Treasury rates has shrunk from 72 basis points at the beginning of February to 20 basis points on Monday, which is the smallest it has been this year. A flat yield curve tends to have a detrimental effect on banks since it lowers the amount they earn on long-term loans in comparison to the amount they pay on short-term deposits.
At the same time, Korean chip exports in the first twenty days of September were up 259.4 percent compared with the same period the previous year, and total exports rose by 78.3 percent; this is the strongest argument against the idea that we are at the peak of the market.
A narrow market, with a flattening yield curve and strong chip exports, is indeed complex. Comparing it to 1929 doesn’t make it any simpler.
The principle, since it is the reusable part
If a comparison is unexpected, the right question to ask should be which definition makes it true and whether anyone actually expressed it in that way.
Almost all statistics based on the ‘last seen in’ figure involve a flexible parameter—for example, the lookback window, the use of closing prices or intraday prices, or the selection of which index members to include. If the parameter is altered, then the comparison either changes or vanishes.
We are not saying that those who published these statistics were careless. Rather, what we mean is that by the time a statistic gets to you it has generally been repeated several times and the version that remains with people is usually the one with the most impressive phrasing, not the one that gives the most accurate details.
Educational research only. Not personalized investment advice. MB “MoatPeak Group”.